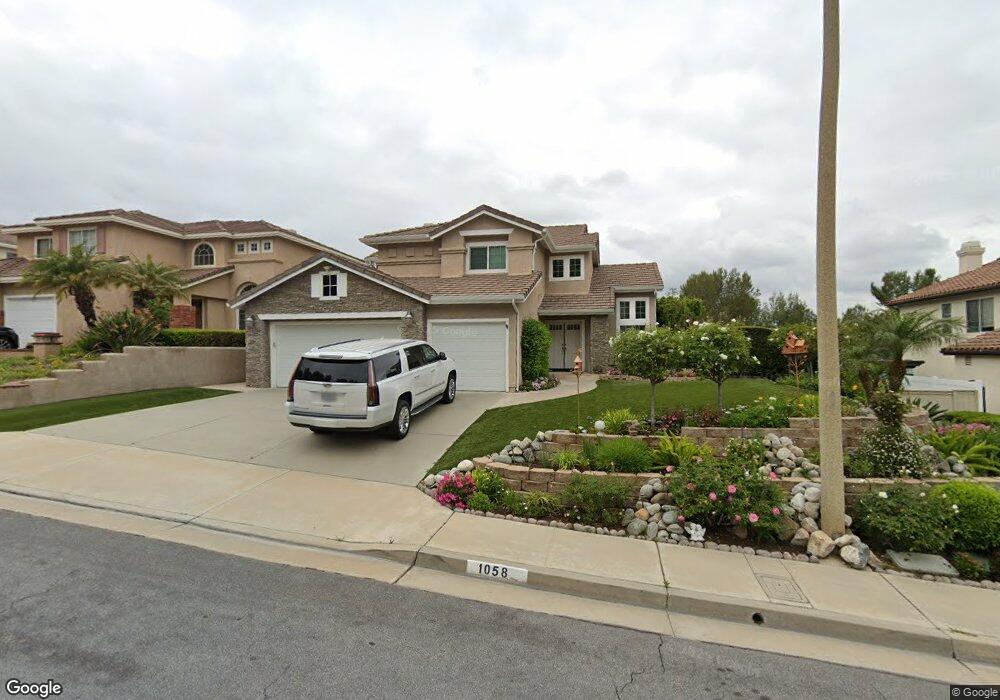
1058 S Cascade Ln Anaheim, CA 92808
Anaheim Hills NeighborhoodEstimated Value: $1,098,466 - $1,511,000
4
Beds
3
Baths
2,125
Sq Ft
$632/Sq Ft
Est. Value
About This Home
This home is located at 1058 S Cascade Ln, Anaheim, CA 92808 and is currently estimated at $1,343,617, approximately $632 per square foot. 1058 S Cascade Ln is a home located in Orange County with nearby schools including Running Springs Elementary, Canyon High School, and El Rancho Charter.
Ownership History
Date
Name
Owned For
Owner Type
Purchase Details
Closed on
Dec 5, 2000
Sold by
Bogart Gregory B and Bogart Denise M
Bought by
Bogart Gregory B and Bogart Denise M
Current Estimated Value
Purchase Details
Closed on
Sep 1, 2000
Sold by
Bogart Gregory B and Bogart Denise M
Bought by
Bogart Gregory B and Bogart Denise M
Home Financials for this Owner
Home Financials are based on the most recent Mortgage that was taken out on this home.
Original Mortgage
$245,000
Outstanding Balance
$89,104
Interest Rate
8.07%
Estimated Equity
$1,254,513
Purchase Details
Closed on
Apr 22, 1998
Sold by
Brian Bogart Gregory and Brian Denise M
Bought by
Bogart Gregory B and Bogart Denise M
Purchase Details
Closed on
Mar 29, 1994
Sold by
Kaufman & Broad South Coast Inc
Bought by
Bogart Gregory Brian and Bogart Denise M
Home Financials for this Owner
Home Financials are based on the most recent Mortgage that was taken out on this home.
Original Mortgage
$231,200
Interest Rate
8.3%
Create a Home Valuation Report for This Property
The Home Valuation Report is an in-depth analysis detailing your home's value as well as a comparison with similar homes in the area
Home Values in the Area
Average Home Value in this Area
Purchase History
| Date | Buyer | Sale Price | Title Company |
|---|---|---|---|
| Bogart Gregory B | -- | -- | |
| Bogart Gregory B | -- | Southland Title Corporation | |
| Bogart Gregory B | -- | -- | |
| Bogart Gregory Brian | $257,000 | First American Title Ins Co |
Source: Public Records
Mortgage History
| Date | Status | Borrower | Loan Amount |
|---|---|---|---|
| Open | Bogart Gregory B | $245,000 | |
| Previous Owner | Bogart Gregory Brian | $231,200 |
Source: Public Records
Tax History
| Year | Tax Paid | Tax Assessment Tax Assessment Total Assessment is a certain percentage of the fair market value that is determined by local assessors to be the total taxable value of land and additions on the property. | Land | Improvement |
|---|---|---|---|---|
| 2025 | $4,844 | $436,790 | $142,469 | $294,321 |
| 2024 | $4,844 | $428,226 | $139,676 | $288,550 |
| 2023 | $4,734 | $419,830 | $136,937 | $282,893 |
| 2022 | $4,640 | $411,599 | $134,252 | $277,347 |
| 2021 | $4,511 | $403,529 | $131,620 | $271,909 |
| 2020 | $4,469 | $399,392 | $130,271 | $269,121 |
| 2019 | $4,413 | $391,561 | $127,716 | $263,845 |
| 2018 | $4,345 | $383,884 | $125,212 | $258,672 |
| 2017 | $4,166 | $376,357 | $122,757 | $253,600 |
| 2016 | $4,085 | $368,978 | $120,350 | $248,628 |
| 2015 | $3,972 | $363,436 | $118,542 | $244,894 |
| 2014 | $3,944 | $356,317 | $116,220 | $240,097 |
Source: Public Records
Map
Nearby Homes
- 932 S Country Glen Way
- 8176 E Bailey Way
- 1222 S Silver Star Way
- 1232 S Country Glen Way
- 8109 E Bailey Way
- 1358 S Country Glen Way Unit D
- 910 S Barton Ct
- 1370 S Country Glen Way
- 8142 E Naples Ln
- 1099 S San Marino Way
- 8027 E Naples Ln
- 8830 E Wiley Way Unit 20
- 8047 E Sandstone Dr
- 7835 E Viewrim Dr
- 7912 E Monte Carlo Ave
- 8755 E Garden View Dr
- 520 S Morningstar Dr
- 927 S Firefly Dr
- 701 S Glenhurst Dr Unit 216
- 8070 E Goldenrod Ln Unit 49
- 1048 S Cascade Ln
- 1068 S Cascade Ln
- 1038 S Cascade Ln
- 1078 S Cascade Ln
- 1028 S Cascade Ln
- 1081 S Cascade Ln
- 1088 S Cascade Ln
- 1018 S Cascade Ln
- 1003 S Silver Star Way
- 999 S Silver Star Way
- 1007 S Silver Star Way
- 1011 S Silver Star Way
- 991 S Silver Star Way
- 1008 S Cascade Ln
- 1015 S Silver Star Way
- 8267 E Marblehead Way
- 987 S Silver Star Way
- 8263 E Marblehead Way
- 8273 E Marblehead Way
- 1019 S Silver Star Way
Your Personal Tour Guide
Ask me questions while you tour the home.