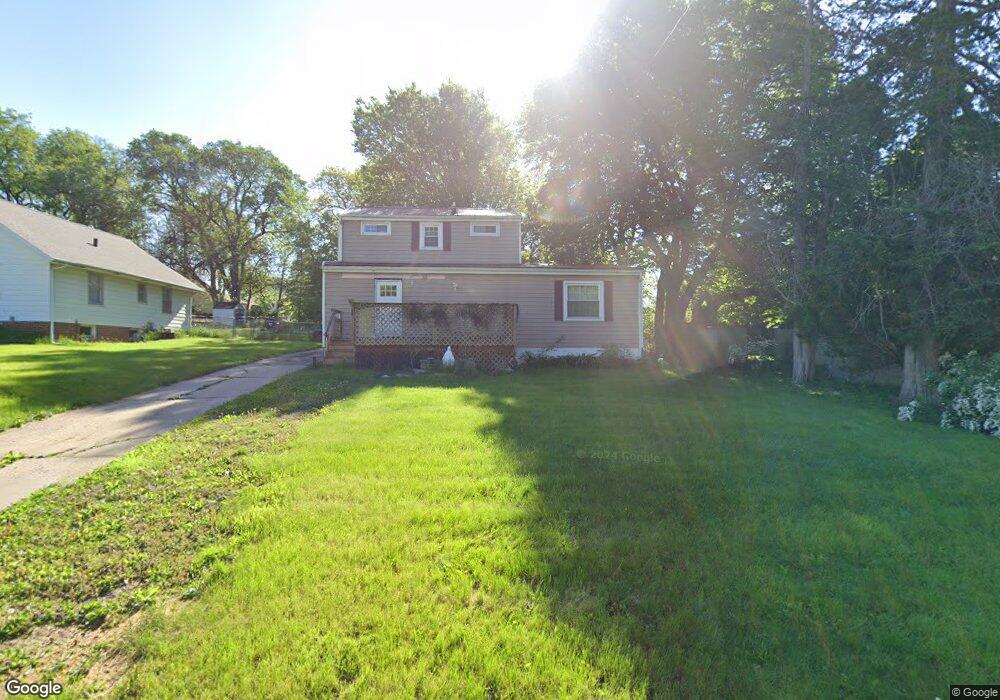
1059 59th St Des Moines, IA 50311
Waveland Woods NeighborhoodEstimated Value: $141,864 - $223,000
2
Beds
2
Baths
1,422
Sq Ft
$120/Sq Ft
Est. Value
About This Home
This home is located at 1059 59th St, Des Moines, IA 50311 and is currently estimated at $170,966, approximately $120 per square foot. 1059 59th St is a home located in Polk County with nearby schools including Windsor Elementary School, Merrill Middle School, and Roosevelt High School.
Ownership History
Date
Name
Owned For
Owner Type
Purchase Details
Closed on
Jul 14, 2021
Sold by
Ashby Dennis D and Ashby Carolyn C
Bought by
Reising Michael Augustine and Reising Carmen Corine
Current Estimated Value
Home Financials for this Owner
Home Financials are based on the most recent Mortgage that was taken out on this home.
Original Mortgage
$85,000
Outstanding Balance
$77,029
Interest Rate
2.96%
Mortgage Type
New Conventional
Estimated Equity
$93,937
Purchase Details
Closed on
Jun 22, 2001
Sold by
Sts Real Estate Management Company Ltd
Bought by
Ashby Dennis D
Create a Home Valuation Report for This Property
The Home Valuation Report is an in-depth analysis detailing your home's value as well as a comparison with similar homes in the area
Home Values in the Area
Average Home Value in this Area
Purchase History
| Date | Buyer | Sale Price | Title Company |
|---|---|---|---|
| Reising Michael Augustine | $90,000 | None Available | |
| Ashby Dennis D | $82,000 | -- |
Source: Public Records
Mortgage History
| Date | Status | Borrower | Loan Amount |
|---|---|---|---|
| Open | Reising Michael Augustine | $85,000 |
Source: Public Records
Tax History Compared to Growth
Tax History
| Year | Tax Paid | Tax Assessment Tax Assessment Total Assessment is a certain percentage of the fair market value that is determined by local assessors to be the total taxable value of land and additions on the property. | Land | Improvement |
|---|---|---|---|---|
| 2025 | $2,000 | $126,700 | $56,300 | $70,400 |
| 2024 | $2,000 | $112,100 | $49,700 | $62,400 |
| 2023 | $1,976 | $112,100 | $49,700 | $62,400 |
| 2022 | $2,552 | $92,700 | $42,700 | $50,000 |
| 2021 | $2,550 | $109,100 | $42,700 | $66,400 |
| 2020 | $2,422 | $102,200 | $39,600 | $62,600 |
| 2019 | $1,956 | $102,200 | $39,600 | $62,600 |
| 2018 | $1,930 | $81,300 | $35,100 | $46,200 |
| 2017 | $1,726 | $81,300 | $35,100 | $46,200 |
| 2016 | $1,676 | $72,300 | $30,600 | $41,700 |
| 2015 | $1,676 | $72,300 | $30,600 | $41,700 |
| 2014 | $1,478 | $66,600 | $28,000 | $38,600 |
Source: Public Records
Map
Nearby Homes
- 5912 Rutland Dr
- 1051 57th St
- 1129 57th St
- 1010 56th St
- 1215 Merle Hay Rd
- 6002 Rollins Ave
- 1243 Merle Hay Rd
- 1129 64th St
- 1304 60th St
- 1236 63rd St
- 1344 57th St
- 6330 Center St
- 720 63rd St
- 6423 Carpenter Ave
- 6420 Center St
- 6750 School St Unit 206
- 6750 School St Unit 205
- 686 63rd St
- 1008 67th St
- 1504 57th Place