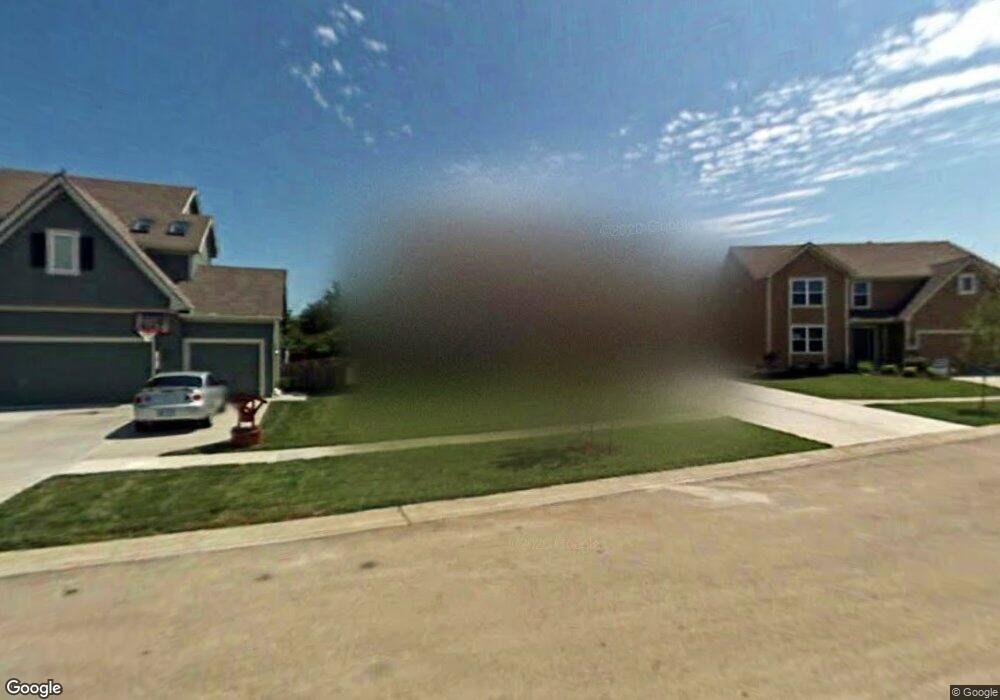
1059 Allyssa Ct Lansing, KS 66043
Estimated Value: $393,000 - $430,000
4
Beds
3
Baths
2,829
Sq Ft
$145/Sq Ft
Est. Value
About This Home
This home is located at 1059 Allyssa Ct, Lansing, KS 66043 and is currently estimated at $409,712, approximately $144 per square foot. 1059 Allyssa Ct is a home located in Leavenworth County with nearby schools including Lansing Elementary School, Lansing Middle 6-8, and Lansing High 9-12.
Ownership History
Date
Name
Owned For
Owner Type
Purchase Details
Closed on
Sep 13, 2024
Sold by
Romano Kevin P and Romano Kerry M
Bought by
Romano Revocable Trust and Romano
Current Estimated Value
Purchase Details
Closed on
Jun 17, 2008
Sold by
R & R Builders Inc
Bought by
Romano Kevin P and Romano Kerry M
Home Financials for this Owner
Home Financials are based on the most recent Mortgage that was taken out on this home.
Original Mortgage
$127,250
Interest Rate
6.05%
Mortgage Type
New Conventional
Create a Home Valuation Report for This Property
The Home Valuation Report is an in-depth analysis detailing your home's value as well as a comparison with similar homes in the area
Home Values in the Area
Average Home Value in this Area
Purchase History
| Date | Buyer | Sale Price | Title Company |
|---|---|---|---|
| Romano Revocable Trust | -- | None Listed On Document | |
| Romano Kevin P | $159,062 | First American Title |
Source: Public Records
Mortgage History
| Date | Status | Borrower | Loan Amount |
|---|---|---|---|
| Previous Owner | Romano Kevin P | $127,250 |
Source: Public Records
Tax History Compared to Growth
Tax History
| Year | Tax Paid | Tax Assessment Tax Assessment Total Assessment is a certain percentage of the fair market value that is determined by local assessors to be the total taxable value of land and additions on the property. | Land | Improvement |
|---|---|---|---|---|
| 2025 | $5,999 | $46,120 | $5,436 | $40,684 |
| 2024 | $5,782 | $44,346 | $5,436 | $38,910 |
| 2023 | $5,782 | $44,346 | $5,436 | $38,910 |
| 2022 | $5,559 | $40,314 | $3,537 | $36,777 |
| 2021 | $5,007 | $34,727 | $3,537 | $31,190 |
| 2020 | $4,846 | $33,074 | $3,537 | $29,537 |
| 2019 | $4,779 | $32,579 | $3,537 | $29,042 |
| 2018 | $4,600 | $31,383 | $3,537 | $27,846 |
| 2017 | $4,390 | $29,897 | $3,537 | $26,360 |
| 2016 | $4,348 | $29,602 | $3,537 | $26,065 |
| 2015 | $4,335 | $29,602 | $3,537 | $26,065 |
| 2014 | $4,079 | $28,451 | $3,537 | $24,914 |
Source: Public Records
Map
Nearby Homes
- 922 Southfork St
- 811 4-H Rd
- 866 Clearview Dr
- 875 Clearview Dr
- 1322 Rock Creek Ct
- 1221 S Desoto Rd
- 527 S Valley Dr
- 833 Rock Creek Dr
- 104 Olive St
- 522 Forestglen Ln
- 202 S Main St
- 124 S Main St
- 24431 139th St
- 546 Hithergreen Dr
- 13788 McIntyre1 Rd
- 13788 Mcintyre Rd
- 13788 McIntyre2 Rd
- 13965 Mc Intyre Rd
- 218 E Kay St
- 20958 Ida St
- 00000 Southfork Rd
- 00000 Southfork Rd Unit 2+/- Acres
- 1057 Allyssa Ct
- 1061 Allyssa Ct
- 1063 Allyssa Ct
- 1058 Allyssa Ct
- 1062 Allyssa Ct
- 1060 Allyssa Ct
- 1056 Wyndham Dr
- 1054 Wyndham Dr
- 1051 Allyssa Ct
- 1052 Wyndham Dr
- 501 Johnson Dr
- 1050 Wyndham Dr
- 1047 Allyssa Ct
- 1057 Wyndham Dr
- 1053 Wyndham Dr
- 938 Wyndham Dr
- 1045 Allyssa Ct
- 1051 Wyndham Dr