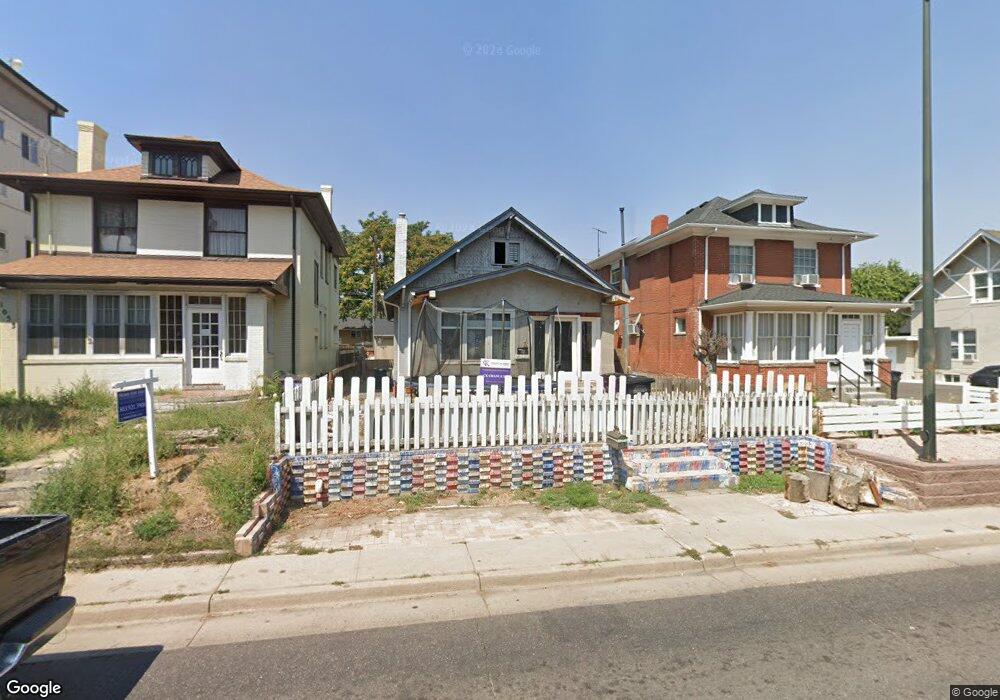
1059 Colorado Blvd Denver, CO 80206
Congress Park NeighborhoodEstimated Value: $688,000 - $787,000
2
Beds
2
Baths
988
Sq Ft
$734/Sq Ft
Est. Value
About This Home
This home is located at 1059 Colorado Blvd, Denver, CO 80206 and is currently estimated at $725,659, approximately $734 per square foot. 1059 Colorado Blvd is a home located in Denver County with nearby schools including Teller Elementary School, Morey Middle School, and East High School.
Ownership History
Date
Name
Owned For
Owner Type
Purchase Details
Closed on
Jul 21, 2006
Sold by
Leigh Robert J
Bought by
Gill Rodney
Current Estimated Value
Home Financials for this Owner
Home Financials are based on the most recent Mortgage that was taken out on this home.
Original Mortgage
$172,710
Outstanding Balance
$121,778
Interest Rate
10.37%
Mortgage Type
Purchase Money Mortgage
Estimated Equity
$603,881
Purchase Details
Closed on
Oct 31, 2000
Sold by
Mandell Evan
Bought by
Leigh Robert J
Home Financials for this Owner
Home Financials are based on the most recent Mortgage that was taken out on this home.
Original Mortgage
$100,050
Interest Rate
7.87%
Purchase Details
Closed on
Mar 10, 2000
Sold by
Brahinsky Joan E
Bought by
Mandell Evan
Home Financials for this Owner
Home Financials are based on the most recent Mortgage that was taken out on this home.
Original Mortgage
$114,400
Interest Rate
8.37%
Create a Home Valuation Report for This Property
The Home Valuation Report is an in-depth analysis detailing your home's value as well as a comparison with similar homes in the area
Home Values in the Area
Average Home Value in this Area
Purchase History
| Date | Buyer | Sale Price | Title Company |
|---|---|---|---|
| Gill Rodney | $181,800 | Land Title | |
| Leigh Robert J | $170,000 | -- | |
| Mandell Evan | $144,000 | -- |
Source: Public Records
Mortgage History
| Date | Status | Borrower | Loan Amount |
|---|---|---|---|
| Open | Gill Rodney | $172,710 | |
| Previous Owner | Leigh Robert J | $100,050 | |
| Previous Owner | Mandell Evan | $114,400 | |
| Closed | Mandell Evan | $28,600 |
Source: Public Records
Tax History Compared to Growth
Tax History
| Year | Tax Paid | Tax Assessment Tax Assessment Total Assessment is a certain percentage of the fair market value that is determined by local assessors to be the total taxable value of land and additions on the property. | Land | Improvement |
|---|---|---|---|---|
| 2024 | $3,362 | $42,450 | $21,130 | $21,320 |
| 2023 | $3,289 | $42,450 | $21,130 | $21,320 |
| 2022 | $2,920 | $36,720 | $17,160 | $19,560 |
| 2021 | $2,819 | $37,780 | $17,650 | $20,130 |
| 2020 | $2,722 | $36,690 | $16,190 | $20,500 |
| 2019 | $2,646 | $36,690 | $16,190 | $20,500 |
| 2018 | $2,623 | $33,900 | $13,330 | $20,570 |
| 2017 | $2,615 | $33,900 | $13,330 | $20,570 |
| 2016 | $2,136 | $26,190 | $13,102 | $13,088 |
| 2015 | $2,046 | $26,190 | $13,102 | $13,088 |
| 2014 | $1,498 | $18,040 | $5,803 | $12,237 |
Source: Public Records
Map
Nearby Homes
- 1035 Colorado Blvd Unit 405
- 1100 Colorado Blvd Unit 305
- 1121 Albion St Unit 207
- 1121 Albion St Unit 601
- 1121 Albion St Unit 305
- 1121 Albion St Unit 906
- 1121 Albion St Unit 402
- 1121 Albion St Unit 809
- 1109 Harrison St
- 1137 Colorado Blvd
- 1140 Harrison St
- 4110 Hale Pkwy Unit 6C
- 4110 Hale Pkwy Unit 1E
- 4110 Hale Pkwy Unit 4J
- 4110 Hale Pkwy Unit 5G
- 4110 Hale Pkwy Unit 5F
- 1155 Ash St Unit 103
- 1155 Ash St Unit 804
- 1155 Ash St Unit 1204
- 1155 Ash St Unit 1202
- 1065 Colorado Blvd
- 1065 Colorado Blvd Unit 1, 2
- 1077 Colorado Blvd
- 1035 Colorado Blvd Unit 601
- 1035 Colorado Blvd Unit PH
- 1035 Colorado Blvd
- 1035 Colorado Blvd Unit 506
- 1035 Colorado Blvd
- 1035 Colorado Blvd Unit 504
- 1035 Colorado Blvd Unit 503
- 1035 Colorado Blvd Unit 502
- 1035 Colorado Blvd Unit 501
- 1035 Colorado Blvd
- 1035 Colorado Blvd Unit 406
- 1035 Colorado Blvd Unit 404
- 1035 Colorado Blvd Unit 403
- 1035 Colorado Blvd Unit 402
- 1035 Colorado Blvd Unit 401
- 1035 Colorado Blvd
- 1035 Colorado Blvd Unit 306