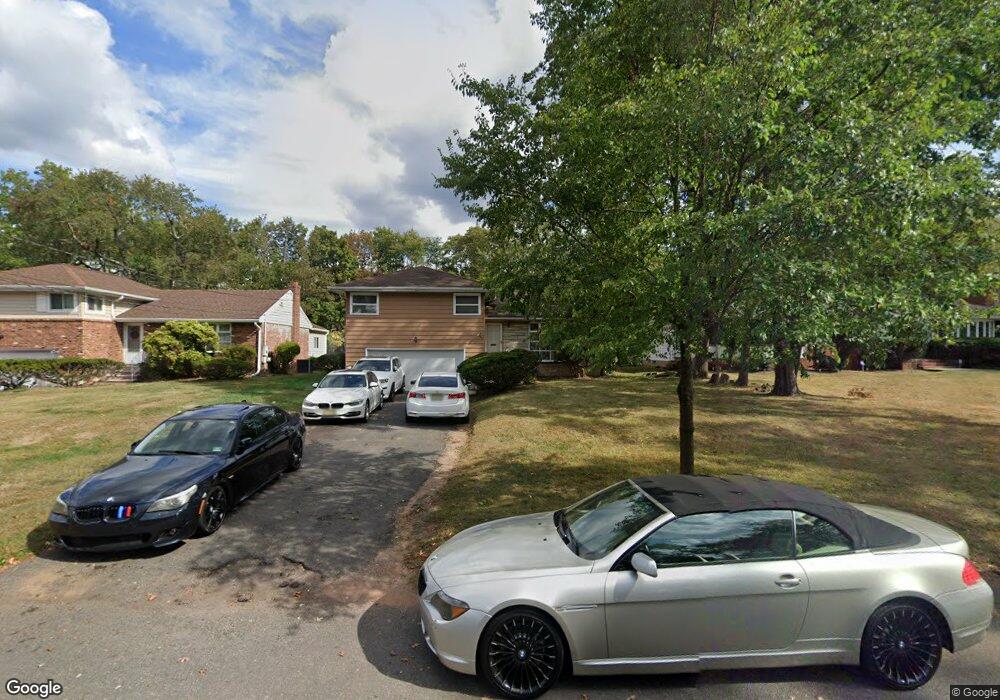
1059 Field Ave Unit 63 Plainfield, NJ 07060
Estimated Value: $520,989 - $588,000
Studio
--
Bath
1,840
Sq Ft
$302/Sq Ft
Est. Value
About This Home
This home is located at 1059 Field Ave Unit 63, Plainfield, NJ 07060 and is currently estimated at $555,747, approximately $302 per square foot. 1059 Field Ave Unit 63 is a home located in Union County with nearby schools including Cedarbrook K-8 Center, Hubbard Middle School, and Plainfield High School.
Ownership History
Date
Name
Owned For
Owner Type
Purchase Details
Closed on
May 31, 2019
Sold by
Grant Desmond
Bought by
Watkins Gwendolyn
Current Estimated Value
Home Financials for this Owner
Home Financials are based on the most recent Mortgage that was taken out on this home.
Original Mortgage
$265,109
Outstanding Balance
$233,096
Interest Rate
4.1%
Mortgage Type
FHA
Estimated Equity
$322,651
Purchase Details
Closed on
May 29, 2018
Sold by
Fannie Mae
Bought by
Grant Desmond
Purchase Details
Closed on
Feb 24, 2017
Sold by
Willis Sydney M
Bought by
Federal National Mortgage Asset
Purchase Details
Closed on
Oct 19, 2007
Sold by
Watkins Raymond H and Watkins Gwendolyn
Bought by
Willis Sydney
Home Financials for this Owner
Home Financials are based on the most recent Mortgage that was taken out on this home.
Original Mortgage
$298,000
Interest Rate
6.14%
Mortgage Type
Purchase Money Mortgage
Create a Home Valuation Report for This Property
The Home Valuation Report is an in-depth analysis detailing your home's value as well as a comparison with similar homes in the area
Home Values in the Area
Average Home Value in this Area
Purchase History
| Date | Buyer | Sale Price | Title Company |
|---|---|---|---|
| Watkins Gwendolyn | $270,000 | Title Experts Llc | |
| Grant Desmond | $176,925 | Fortune Title Agency Inc | |
| Federal National Mortgage Asset | $1,000 | None Available | |
| Willis Sydney | $315,000 | None Available |
Source: Public Records
Mortgage History
| Date | Status | Borrower | Loan Amount |
|---|---|---|---|
| Open | Watkins Gwendolyn | $265,109 | |
| Previous Owner | Willis Sydney | $298,000 |
Source: Public Records
Tax History
| Year | Tax Paid | Tax Assessment Tax Assessment Total Assessment is a certain percentage of the fair market value that is determined by local assessors to be the total taxable value of land and additions on the property. | Land | Improvement |
|---|---|---|---|---|
| 2025 | $10,478 | $120,000 | $45,900 | $74,100 |
| 2024 | $10,375 | $120,000 | $45,900 | $74,100 |
| 2023 | $10,375 | $120,000 | $45,900 | $74,100 |
| 2022 | $10,151 | $120,000 | $45,900 | $74,100 |
| 2021 | $10,062 | $120,000 | $45,900 | $74,100 |
| 2020 | $10,033 | $120,000 | $45,900 | $74,100 |
| 2019 | $10,033 | $120,000 | $45,900 | $74,100 |
| 2018 | $9,823 | $120,000 | $45,900 | $74,100 |
| 2017 | $9,583 | $120,000 | $45,900 | $74,100 |
| 2016 | $9,388 | $120,000 | $45,900 | $74,100 |
| 2015 | $9,110 | $120,000 | $45,900 | $74,100 |
| 2014 | -- | $120,000 | $45,900 | $74,100 |
Source: Public Records
Map
Nearby Homes
- 1039-41 Field Ave
- 1039 Field Ave Unit 41
- 911 13 Plainfield Ave
- 911 Plainfield Ave Unit 13
- 711 Pemberton Ave Unit 13
- 957 Central Ave Unit 63
- 413 W 8th St
- 944 Madison Ave Unit 46
- 614-34 W 8th St Unit 15
- 78-80 Parkside Rd
- 901 Sherman Ave Unit 11
- 1209 Rose St Unit 13
- 1065 Rose St Unit 69
- 1209 Arlington Ave Unit B
- 820 W 8th St Unit 22
- 542 W 6th St
- 1712 Kenyon Ave
- 1716 Kenyon Ave
- 610-16 Darrow Ave
- 720 Madison Ave Unit 22
- 1055 Field Ave Unit 57
- 1065 Field Ave Unit 69
- 1053 Field Ave
- 1047 Field Ave Unit 49
- 1071 Field Ave Unit 75
- 1052 Field Ave Unit 56
- 500 Alletta St Unit 6
- 1048 Field Ave Unit 50
- 1043 Field Ave Unit 45
- 1044 Field Ave Unit 46
- 1046 Field Ave
- 1066 Central Ave
- 1077 Field Ave Unit 79
- 508 Alletta St Unit 10
- 510 Alletta St
- 1042 Field Ave
- 1081 Field Ave Unit 83
- 1040 Field Ave
- 501 Alletta St Unit 5
- 1053 Ironbound Ave Unit 55
Your Personal Tour Guide
Ask me questions while you tour the home.