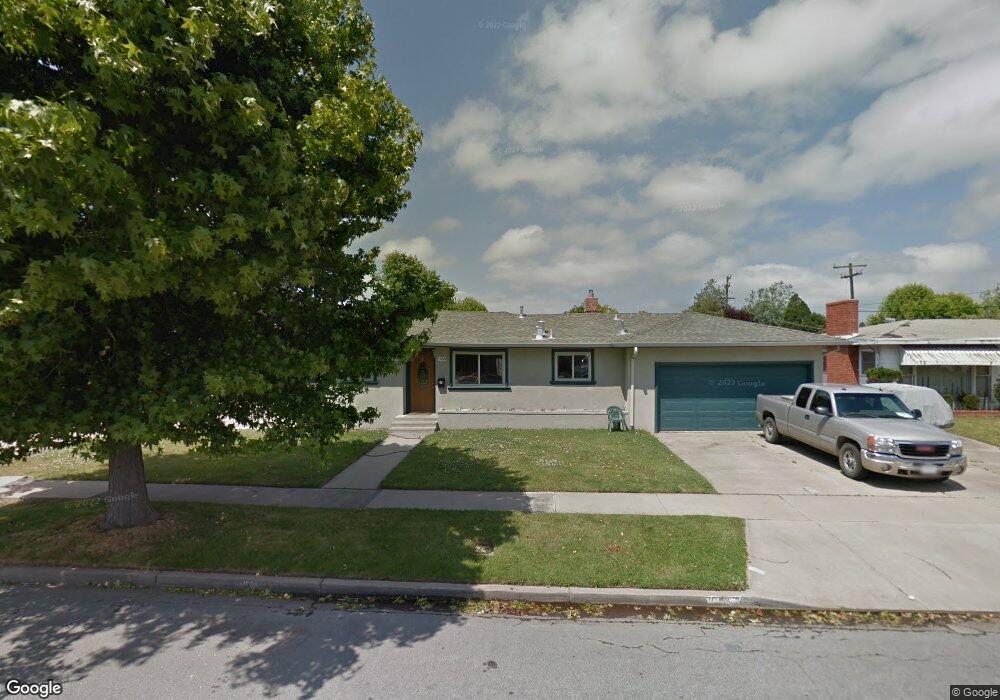
1059 Harding St Salinas, CA 93906
Sherwood Gardens NeighborhoodEstimated Value: $657,933 - $681,000
3
Beds
2
Baths
1,183
Sq Ft
$566/Sq Ft
Est. Value
About This Home
This home is located at 1059 Harding St, Salinas, CA 93906 and is currently estimated at $669,733, approximately $566 per square foot. 1059 Harding St is a home located in Monterey County with nearby schools including Henry F. Kammann Elementary School, Boronda Meadows Elementary School, and Harden Middle School.
Ownership History
Date
Name
Owned For
Owner Type
Purchase Details
Closed on
Jan 23, 2018
Sold by
Crane Kevin R and Johnson Zalissa R
Bought by
Jhonson Zalissa R
Current Estimated Value
Home Financials for this Owner
Home Financials are based on the most recent Mortgage that was taken out on this home.
Original Mortgage
$223,984
Outstanding Balance
$189,878
Interest Rate
4.12%
Mortgage Type
FHA
Estimated Equity
$479,855
Purchase Details
Closed on
Jun 6, 2008
Sold by
Deutsche Bank National Trust Co
Bought by
Crane Kevin R and Cross Zalissa R
Home Financials for this Owner
Home Financials are based on the most recent Mortgage that was taken out on this home.
Original Mortgage
$262,874
Interest Rate
5.99%
Mortgage Type
FHA
Purchase Details
Closed on
Oct 25, 2007
Sold by
Maldonado Gilbert and Maldonado Barbara E
Bought by
Deutsche Bank National Trust Co and Ameriquest Mortgage Securities Inc Asset
Create a Home Valuation Report for This Property
The Home Valuation Report is an in-depth analysis detailing your home's value as well as a comparison with similar homes in the area
Home Values in the Area
Average Home Value in this Area
Purchase History
| Date | Buyer | Sale Price | Title Company |
|---|---|---|---|
| Jhonson Zalissa R | -- | Placer Title Co | |
| Crane Kevin R | $267,000 | Stewart Title Of Ca Inc | |
| Deutsche Bank National Trust Co | $365,575 | Accommodation |
Source: Public Records
Mortgage History
| Date | Status | Borrower | Loan Amount |
|---|---|---|---|
| Open | Jhonson Zalissa R | $223,984 | |
| Previous Owner | Crane Kevin R | $262,874 |
Source: Public Records
Tax History
| Year | Tax Paid | Tax Assessment Tax Assessment Total Assessment is a certain percentage of the fair market value that is determined by local assessors to be the total taxable value of land and additions on the property. | Land | Improvement |
|---|---|---|---|---|
| 2025 | $4,042 | $350,708 | $256,139 | $94,569 |
| 2024 | $4,042 | $343,832 | $251,117 | $92,715 |
| 2023 | $3,906 | $337,092 | $246,194 | $90,898 |
| 2022 | $3,760 | $330,483 | $241,367 | $89,116 |
| 2021 | $3,612 | $324,004 | $236,635 | $87,369 |
| 2020 | $3,512 | $320,683 | $234,209 | $86,474 |
| 2019 | $3,486 | $314,396 | $229,617 | $84,779 |
| 2018 | $3,442 | $308,232 | $225,115 | $83,117 |
| 2017 | $3,444 | $302,189 | $220,701 | $81,488 |
| 2016 | $3,447 | $296,265 | $216,374 | $79,891 |
| 2015 | $3,477 | $291,815 | $213,124 | $78,691 |
| 2014 | $3,039 | $238,000 | $174,000 | $64,000 |
Source: Public Records
Map
Nearby Homes
- 1170 Tyler St
- 217 Iris Dr
- 1103 Sherman Dr
- 1075 Sherman Dr
- 282 Noice Dr
- 561 Powell St
- 208 Diablo Dr
- 15 Saint Francis Way
- 350 Victor St
- 24 Saint Francis Way
- 1515 Aragon Cir
- 730 N Main St
- 336 Rainier Dr
- 110 W Rossi St Unit 6
- 104 W Rossi St Unit 13
- 1520 Ebro Cir
- 1588 Cherokee Dr
- 230 Martella St
- 1664 Seville St
- 218 Christensen Ave
Your Personal Tour Guide
Ask me questions while you tour the home.