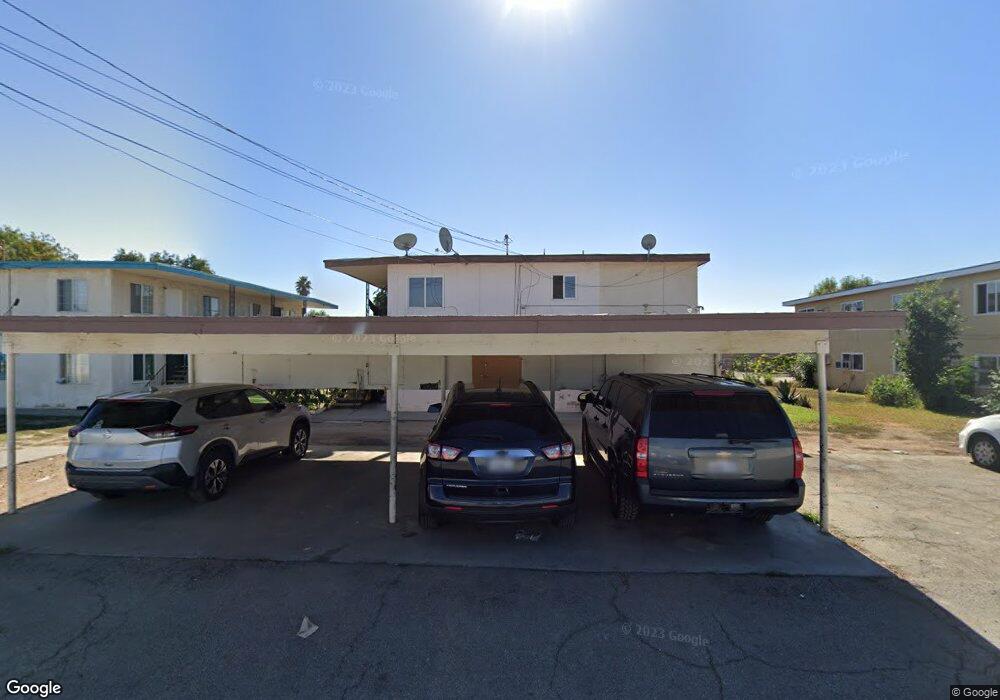
1059 W 8th St Unit A Pomona, CA 91766
Ganesha NeighborhoodEstimated Value: $987,000 - $1,290,000
2
Beds
1
Bath
875
Sq Ft
$1,299/Sq Ft
Est. Value
About This Home
This home is located at 1059 W 8th St Unit A, Pomona, CA 91766 and is currently estimated at $1,136,316, approximately $1,298 per square foot. 1059 W 8th St Unit A is a home located in Los Angeles County with nearby schools including Lopez Elementary School, Fremont Academy of Engineering and Design, and Garey High School.
Ownership History
Date
Name
Owned For
Owner Type
Purchase Details
Closed on
Dec 16, 2016
Sold by
Trink Nhan
Bought by
Ndt Properties Llc
Current Estimated Value
Purchase Details
Closed on
Jun 9, 2016
Sold by
Salvador Silvia Belen
Bought by
Trinh Nhan and Trang Gioi
Home Financials for this Owner
Home Financials are based on the most recent Mortgage that was taken out on this home.
Original Mortgage
$476,250
Interest Rate
3.57%
Mortgage Type
New Conventional
Purchase Details
Closed on
Jul 10, 2010
Sold by
Salvador Rafael A
Bought by
Salvador Silvia Belen and Salvador Ximena Electra
Purchase Details
Closed on
Jun 25, 1999
Sold by
Barreto Marcelo
Bought by
Salvador Rafael A and Salvador Angela Maria
Purchase Details
Closed on
Nov 30, 1995
Sold by
Salvador Rafael A and Salvador Angela Maria
Bought by
Barreto Marcelo and Barreto Silvia S
Create a Home Valuation Report for This Property
The Home Valuation Report is an in-depth analysis detailing your home's value as well as a comparison with similar homes in the area
Home Values in the Area
Average Home Value in this Area
Purchase History
| Date | Buyer | Sale Price | Title Company |
|---|---|---|---|
| Ndt Properties Llc | -- | None Available | |
| Trinh Nhan | $635,000 | Chicago Title Company | |
| Salvador Silvia Belen | -- | Accommodation | |
| Salvador Rafael A | -- | -- | |
| Barreto Marcelo | -- | -- |
Source: Public Records
Mortgage History
| Date | Status | Borrower | Loan Amount |
|---|---|---|---|
| Previous Owner | Trinh Nhan | $476,250 |
Source: Public Records
Tax History Compared to Growth
Tax History
| Year | Tax Paid | Tax Assessment Tax Assessment Total Assessment is a certain percentage of the fair market value that is determined by local assessors to be the total taxable value of land and additions on the property. | Land | Improvement |
|---|---|---|---|---|
| 2025 | $9,781 | $751,705 | $236,756 | $514,949 |
| 2024 | $9,781 | $736,966 | $232,114 | $504,852 |
| 2023 | $9,590 | $722,516 | $227,563 | $494,953 |
| 2022 | $9,438 | $708,350 | $223,101 | $485,249 |
| 2021 | $9,214 | $694,462 | $218,727 | $475,735 |
| 2019 | $9,409 | $673,866 | $212,241 | $461,625 |
| 2018 | $8,700 | $660,654 | $208,080 | $452,574 |
| 2017 | $8,553 | $647,700 | $204,000 | $443,700 |
| 2016 | $3,035 | $197,416 | $82,541 | $114,875 |
| 2015 | $3,011 | $194,452 | $81,302 | $113,150 |
| 2014 | $3,016 | $190,644 | $79,710 | $110,934 |
Source: Public Records
Map
Nearby Homes
- 934 W 11th St
- 988 W 12th St
- 991 W 3rd St
- 1265 W Mission Blvd
- 1300 W Mission Blvd
- 1060 S Rebecca St
- 971 W 2nd St
- 565 W 9th St
- 275 S Rebecca St
- 1368 W 1st St
- 115 S Myrtle Ave
- 1261 W Fernleaf Ave
- 1356 S White Ave
- 1401 W 9th St Unit 56
- 1401 W 9th St Unit 75
- 128 N Myrtle Ave
- 1423 S Hamilton Blvd Unit 1425
- 1425 S White Ave Unit A
- 1363 Buena Vista Ave
- 264 Oak Ave
- 1059 W 8th St
- 1047 W 8th St Unit A
- 1047 W 8th St
- 1071 W 8th St
- 1035 W 8th St
- 1083 W 8th St
- 1023 W 8th St
- 1095 W 8th St
- 804 S Hamilton Blvd
- 836 S Hamilton Blvd
- 1011 W 8th St
- 848 S Hamilton Blvd
- 680 S Hamilton Blvd
- 1073 W 9th St
- 890 S Hamilton Blvd
- 1065 W 9th St
- 674 S Hamilton Blvd
- 896 S Hamilton Blvd
- 652 S Hamilton Blvd
- 630 S Hamilton Blvd