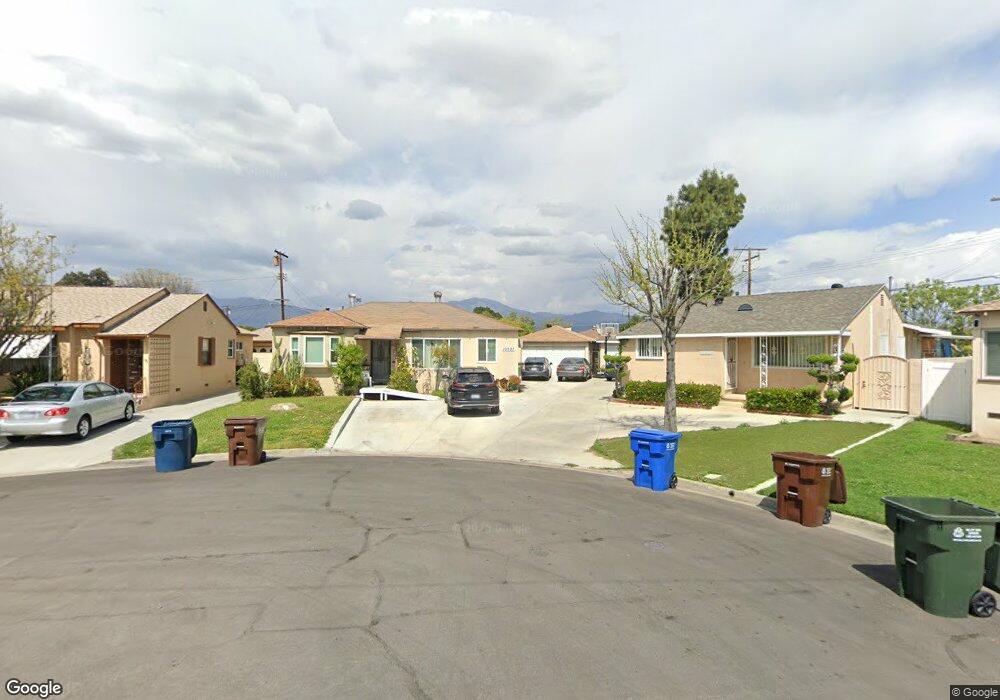
10591 Haverly St El Monte, CA 91731
Northwest El Monte NeighborhoodEstimated Value: $746,000 - $797,000
3
Beds
1
Bath
1,024
Sq Ft
$753/Sq Ft
Est. Value
About This Home
This home is located at 10591 Haverly St, El Monte, CA 91731 and is currently estimated at $771,549, approximately $753 per square foot. 10591 Haverly St is a home located in Los Angeles County with nearby schools including Rio Vista Elementary School, Gidley Elementary School, and Arroyo High School.
Ownership History
Date
Name
Owned For
Owner Type
Purchase Details
Closed on
Dec 2, 2013
Sold by
Jpmorgan Chase Bank Na
Bought by
Chan Wing Shan
Current Estimated Value
Purchase Details
Closed on
Feb 13, 2013
Sold by
Federal Home Loan Mortgage Corporation
Bought by
Jpmorgan Chase Bank Na
Purchase Details
Closed on
Apr 14, 2011
Sold by
Chase Home Finance Llc
Bought by
Federal Home Loan Mortgage Corp
Purchase Details
Closed on
Nov 30, 2010
Sold by
Chan Wing Shan
Bought by
Chase Home Finance Llc
Purchase Details
Closed on
Jun 10, 2008
Sold by
Choi Kin Sang and Chan Wing Shan
Bought by
Jalex Investment Group Inc
Purchase Details
Closed on
Aug 30, 2004
Sold by
Chan Wing Shan
Bought by
Choi Kin Sang and Chan Wing Shan
Home Financials for this Owner
Home Financials are based on the most recent Mortgage that was taken out on this home.
Original Mortgage
$270,000
Interest Rate
5.92%
Mortgage Type
New Conventional
Purchase Details
Closed on
Aug 26, 2004
Sold by
Choi Kin Sang and Chan Wing Shan
Bought by
Chan Wing Shan
Home Financials for this Owner
Home Financials are based on the most recent Mortgage that was taken out on this home.
Original Mortgage
$270,000
Interest Rate
5.92%
Mortgage Type
New Conventional
Purchase Details
Closed on
Nov 19, 2003
Sold by
Chan Wing Shan
Bought by
Choi Kin Sang and Chan Wing Shan
Home Financials for this Owner
Home Financials are based on the most recent Mortgage that was taken out on this home.
Original Mortgage
$250,000
Interest Rate
5.89%
Mortgage Type
Purchase Money Mortgage
Purchase Details
Closed on
Oct 28, 2003
Sold by
Nguyen Kimberly Thanh
Bought by
Chan Wing Shan
Home Financials for this Owner
Home Financials are based on the most recent Mortgage that was taken out on this home.
Original Mortgage
$250,000
Interest Rate
5.89%
Mortgage Type
Purchase Money Mortgage
Purchase Details
Closed on
Jul 22, 2002
Sold by
Darden Jalanda
Bought by
Nguyen Kimberly Thanh
Home Financials for this Owner
Home Financials are based on the most recent Mortgage that was taken out on this home.
Original Mortgage
$202,500
Interest Rate
6.51%
Purchase Details
Closed on
Dec 7, 1998
Sold by
Goldberg Herbert and Goldberg Hedda
Bought by
Darden Jalanda
Home Financials for this Owner
Home Financials are based on the most recent Mortgage that was taken out on this home.
Original Mortgage
$152,229
Interest Rate
6.63%
Mortgage Type
FHA
Purchase Details
Closed on
Aug 25, 1998
Sold by
Pinelli Matthew J and Pinelli Barbara A
Bought by
Goldberg Herbert
Create a Home Valuation Report for This Property
The Home Valuation Report is an in-depth analysis detailing your home's value as well as a comparison with similar homes in the area
Home Values in the Area
Average Home Value in this Area
Purchase History
We collect this data history from publicly available records. To have your information removed, we recommend requesting removal directly through your county’s website.
| Date | Buyer | Sale Price | Title Company |
|---|---|---|---|
| Chan Wing Shan | -- | None Available | |
| Jpmorgan Chase Bank Na | -- | None Available | |
| Federal Home Loan Mortgage Corp | -- | None Available | |
| Chase Home Finance Llc | $289,421 | Accommodation | |
| Jalex Investment Group Inc | -- | None Available | |
| Choi Kin Sang | -- | Investors Title Company | |
| Chan Wing Shan | -- | Investors Title Company | |
| Choi Kin Sang | -- | -- | |
| Chan Wing Shan | -- | Southland Title | |
| Chan Wing Shan | $280,000 | Southland Title | |
| Nguyen Kimberly Thanh | $230,000 | Fidelity National Title Co | |
| Darden Jalanda | $154,000 | -- | |
| Goldberg Herbert | $111,799 | -- |
Source: Public Records
Mortgage History
We collect this data history from publicly available records. To have your information removed, we recommend requesting removal directly through your county’s website.
| Date | Status | Borrower | Loan Amount |
|---|---|---|---|
| Previous Owner | Chan Wing Shan | $270,000 | |
| Previous Owner | Chan Wing Shan | $250,000 | |
| Previous Owner | Nguyen Kimberly Thanh | $202,500 | |
| Previous Owner | Darden Jalanda | $152,229 |
Source: Public Records
Tax History
| Year | Tax Paid | Tax Assessment Tax Assessment Total Assessment is a certain percentage of the fair market value that is determined by local assessors to be the total taxable value of land and additions on the property. | Land | Improvement |
|---|---|---|---|---|
| 2025 | $6,723 | $459,713 | $302,101 | $157,612 |
| 2024 | $6,429 | $450,700 | $296,178 | $154,522 |
| 2023 | $6,362 | $441,864 | $290,371 | $151,493 |
| 2022 | $6,086 | $433,201 | $284,678 | $148,523 |
| 2021 | $6,171 | $424,708 | $279,097 | $145,611 |
| 2020 | $6,146 | $420,354 | $276,236 | $144,118 |
| 2019 | $6,195 | $412,113 | $270,820 | $141,293 |
| 2018 | $6,045 | $404,033 | $265,510 | $138,523 |
| 2016 | $5,799 | $388,345 | $255,200 | $133,145 |
| 2015 | $5,737 | $382,513 | $251,367 | $131,146 |
| 2014 | $5,483 | $373,000 | $245,000 | $128,000 |
Source: Public Records
Map
Nearby Homes
- 4577 Ranger Ave
- 10631 Marsen St
- 4825 Arden Dr
- 4921 Glickman Ave
- 4800 Daleview Ave Unit 41
- 5122 Halifax Rd
- 10236 Green St
- 4918 Baldwin Ave
- 11125 Basye St Unit D
- 5155 Arden Dr
- 11408 Primrose Ln
- 11450 Clover Ln
- 11446 Clover Ln
- 11454 Clover Ln
- 11427 Wildflower Ln
- 11440 Clover Ln
- 11405 Primrose Ln
- 11402 Primrose Ln
- 11442 Clover Ln
- 11401 Primrose Ln
- 10587 Haverly St
- 10595 Haverly St
- 10590 Emery St
- 10586 Emery St
- 10583 Haverly St
- 10597 Haverly St
- 4566 Esto Ave
- 10594 Emery St
- 4572 Esto Ave
- 4563 Shasta Place
- 4567 Shasta Place
- 4555 Shasta Place
- 10596 Haverly St
- 10588 Haverly St
- 10590 Haverly St
- 4573 Shasta Place
- 10582 Haverly St
- 4551 Shasta Place
- 4602 Pal Mal Ave
- 10573 Haverly St
Your Personal Tour Guide
Ask me questions while you tour the home.