Estimated Value: $383,000 - $415,000
3
Beds
2
Baths
1,422
Sq Ft
$281/Sq Ft
Est. Value
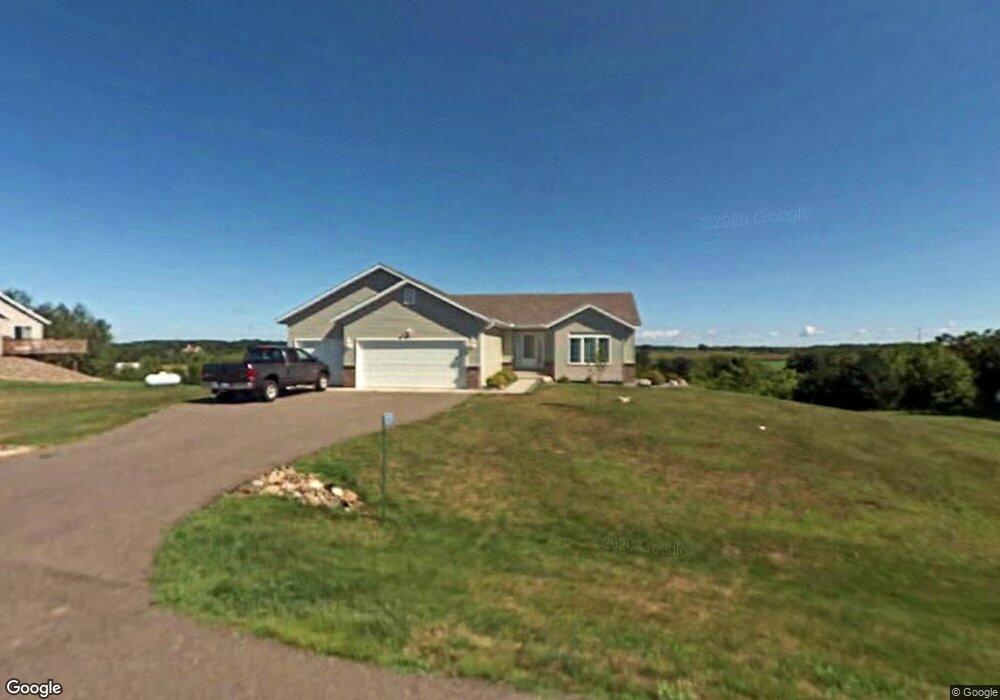
About This Home
This home is located at 10595 Raven Loop, Foley, MN 56329 and is currently estimated at $399,048, approximately $280 per square foot. 10595 Raven Loop is a home located in Benton County with nearby schools including Foley Elementary School, Foley Intermediate Elementary School, and Foley Senior High School.
Ownership History
Date
Name
Owned For
Owner Type
Purchase Details
Closed on
Jun 25, 2025
Sold by
Lindgren Michael C and Lindgren Melanie R
Bought by
Dumonceaux Jaclyn
Current Estimated Value
Purchase Details
Closed on
Jun 21, 2019
Sold by
Lindgren Michael and Lindgren Melanie R
Bought by
Lindgren Michael C and Lindgren Melanie R
Home Financials for this Owner
Home Financials are based on the most recent Mortgage that was taken out on this home.
Original Mortgage
$153,600
Interest Rate
4%
Mortgage Type
New Conventional
Purchase Details
Closed on
Dec 23, 2010
Sold by
Deutsche Bank National Trust Company
Bought by
Lindgren Michael
Home Financials for this Owner
Home Financials are based on the most recent Mortgage that was taken out on this home.
Original Mortgage
$134,715
Interest Rate
4.92%
Mortgage Type
New Conventional
Create a Home Valuation Report for This Property
The Home Valuation Report is an in-depth analysis detailing your home's value as well as a comparison with similar homes in the area
Purchase History
| Date | Buyer | Sale Price | Title Company |
|---|---|---|---|
| Dumonceaux Jaclyn | $410,000 | First American Title | |
| Lindgren Michael C | -- | None Available | |
| Lindgren Michael | $27,000 | -- |
Source: Public Records
Mortgage History
| Date | Status | Borrower | Loan Amount |
|---|---|---|---|
| Previous Owner | Lindgren Michael C | $153,600 | |
| Previous Owner | Lindgren Michael | $134,715 |
Source: Public Records
Tax History
| Year | Tax Paid | Tax Assessment Tax Assessment Total Assessment is a certain percentage of the fair market value that is determined by local assessors to be the total taxable value of land and additions on the property. | Land | Improvement |
|---|---|---|---|---|
| 2025 | $5,474 | $401,500 | $31,900 | $369,600 |
| 2024 | $3,870 | $403,700 | $31,500 | $372,200 |
| 2023 | $3,606 | $410,700 | $31,500 | $379,200 |
| 2022 | $3,212 | $349,800 | $31,800 | $318,000 |
| 2021 | $3,092 | $278,700 | $29,800 | $248,900 |
| 2018 | $2,864 | $206,300 | $25,210 | $181,090 |
| 2017 | $2,864 | $190,400 | $24,894 | $165,506 |
| 2016 | $2,774 | $204,000 | $27,300 | $176,700 |
| 2015 | $2,650 | $163,200 | $33,545 | $129,655 |
| 2014 | -- | $175,500 | $35,783 | $139,717 |
| 2013 | -- | $192,500 | $48,216 | $144,284 |
Source: Public Records
Map
Nearby Homes
- 10485 Raven Loop NE
- 9260 Highway 95 NE
- 1406 23rd St NE
- Lot B 75th Ave NE
- 11570 42nd St SE
- 11507 42nd St SE
- 4468 109th Ave
- 433 60th Ave SE
- 5926 Rub-Of-the-green St
- 5916 Stadium St
- 5913 Rub-Of-the-green St
- 5901 Rub-Of-the-green St
- 5376 Tee-To-green St
- TBD 17th St
- 5361 Sand Bunker St
- 5345 Sand Bunker St
- 444 53rd Ave SE
- 4291 135th Ave
- 5367 114th Ave
- 9929 55th St
- 10655 Raven Loop NE
- 10615 Raven Loop NE
- 10575 Raven Loop
- 10615 Raven Loop
- 10600 Raven Loop NE
- 10600 Raven Loop
- 10580 Raven Loop
- 10555 Raven Loop
- 10635 Raven Loop
- 10620 Raven Loop
- 10560 Raven Loop
- 10535 Raven Loop
- 10640 Raven Loop
- 10640 Raven Loop
- 10540 Raven Loop
- 10655 Raven Loop
- 10712 Duelm Rd NE
- 10580 Duelm Rd NE
- 10515 Raven Loop
- 10520 Raven Loop
Your Personal Tour Guide
Ask me questions while you tour the home.