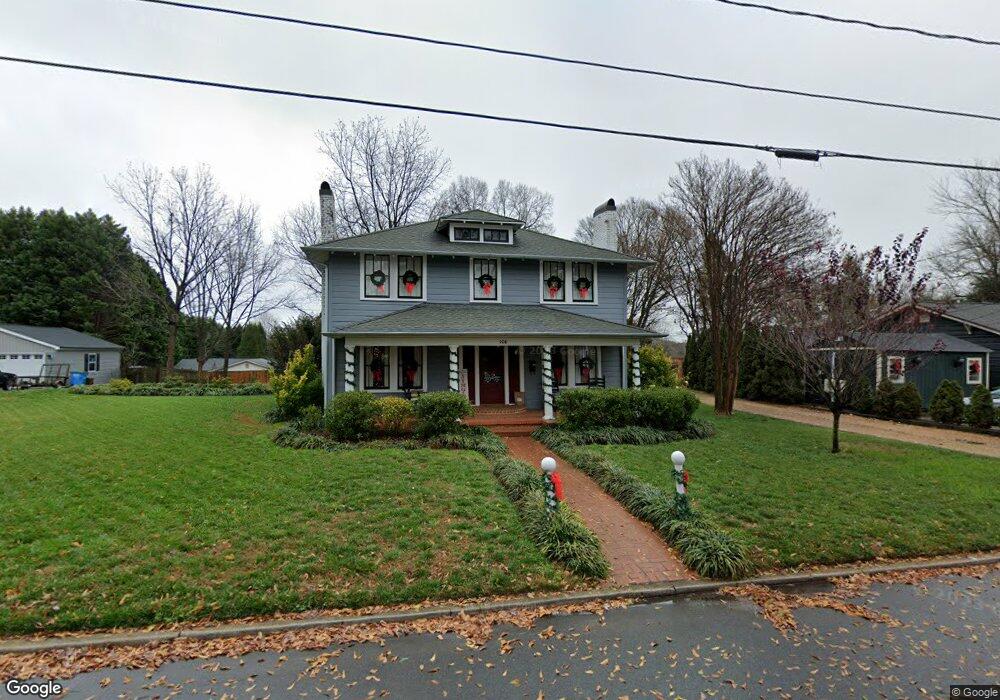
106 9th St Belmont, NC 28012
Estimated Value: $383,000 - $506,000
4
Beds
3
Baths
2,304
Sq Ft
$192/Sq Ft
Est. Value
About This Home
This home is located at 106 9th St, Belmont, NC 28012 and is currently estimated at $443,481, approximately $192 per square foot. 106 9th St is a home located in Gaston County with nearby schools including J B Page Elementary School, Belmont Central Elementary School, and Belmont Middle School.
Ownership History
Date
Name
Owned For
Owner Type
Purchase Details
Closed on
Mar 29, 2005
Sold by
Federal Home Loan Mortgage Corporation
Bought by
Maynard Chris and Maynard Angela
Current Estimated Value
Home Financials for this Owner
Home Financials are based on the most recent Mortgage that was taken out on this home.
Original Mortgage
$125,700
Outstanding Balance
$63,683
Interest Rate
5.5%
Mortgage Type
Construction
Estimated Equity
$379,798
Purchase Details
Closed on
Dec 21, 2004
Sold by
Mitchell Joseph T and Abn Amro Mortgage Group Inc
Bought by
Federal Home Loan Mortgage Corporation
Create a Home Valuation Report for This Property
The Home Valuation Report is an in-depth analysis detailing your home's value as well as a comparison with similar homes in the area
Home Values in the Area
Average Home Value in this Area
Purchase History
| Date | Buyer | Sale Price | Title Company |
|---|---|---|---|
| Maynard Chris | -- | -- | |
| Federal Home Loan Mortgage Corporation | $60,890 | -- |
Source: Public Records
Mortgage History
| Date | Status | Borrower | Loan Amount |
|---|---|---|---|
| Open | Maynard Chris | $125,700 |
Source: Public Records
Tax History Compared to Growth
Tax History
| Year | Tax Paid | Tax Assessment Tax Assessment Total Assessment is a certain percentage of the fair market value that is determined by local assessors to be the total taxable value of land and additions on the property. | Land | Improvement |
|---|---|---|---|---|
| 2025 | $3,752 | $355,990 | $55,000 | $300,990 |
| 2024 | $3,752 | $355,990 | $55,000 | $300,990 |
| 2023 | $3,791 | $355,990 | $55,000 | $300,990 |
| 2022 | $2,012 | $154,150 | $22,500 | $131,650 |
| 2021 | $2,073 | $154,150 | $22,500 | $131,650 |
| 2019 | $2,089 | $154,150 | $22,500 | $131,650 |
| 2018 | $1,320 | $95,331 | $14,400 | $80,931 |
| 2017 | $1,282 | $95,331 | $14,400 | $80,931 |
| 2016 | $1,282 | $95,331 | $0 | $0 |
| 2014 | $1,249 | $92,875 | $18,000 | $74,875 |
Source: Public Records
Map
Nearby Homes
- 1 Linestowe Dr
- 201 Sloan St
- 204 13th St
- 206 13th St
- 901 Edgemont Ave
- 405 Linestowe Dr
- 70 Volk St
- 318 6th St
- 302 Planetree Dr
- 104 Mckee Cir
- 5 S 1st St
- 5949 Gilchrist Cir
- 1213 Sandra Ct
- 6828 Wilkinson Blvd
- 201 Browntown Rd
- 203 Ewing Dr
- 4830 Samuel Pinckney Dr
- 5141 Bright Rd
- 116 Saint Giles Ct
- 229 Browntown Rd