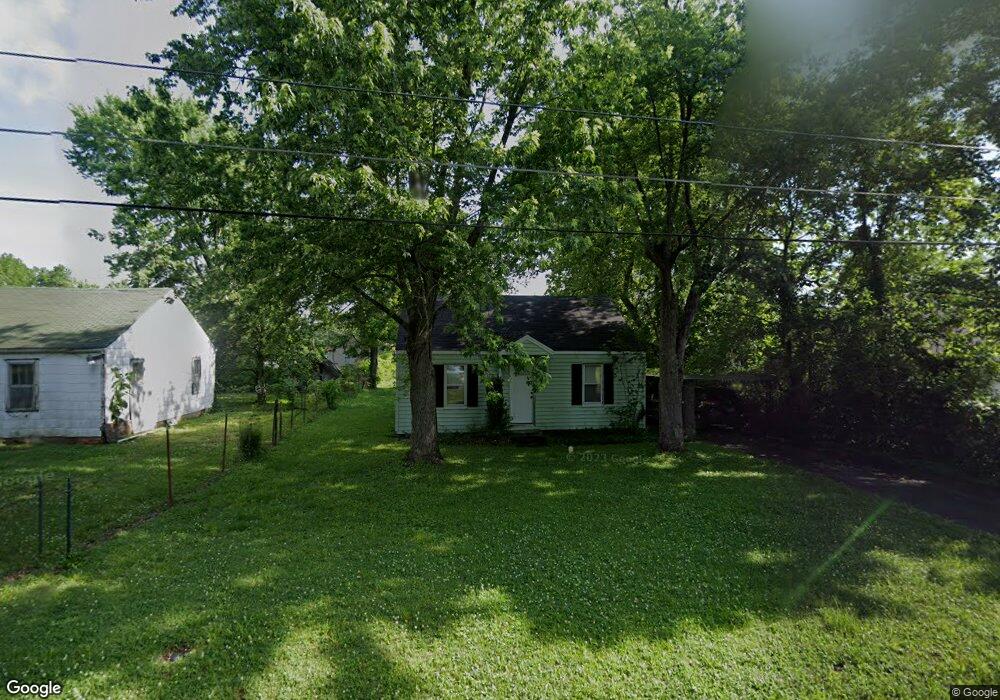
106 Alta Ave Shelbyville, TN 37160
Estimated Value: $77,000 - $185,000
--
Bed
1
Bath
728
Sq Ft
$161/Sq Ft
Est. Value
About This Home
This home is located at 106 Alta Ave, Shelbyville, TN 37160 and is currently estimated at $117,189, approximately $160 per square foot. 106 Alta Ave is a home located in Bedford County with nearby schools including Eakin Elementary School, Harris Middle School, and Victory Baptist Academy.
Ownership History
Date
Name
Owned For
Owner Type
Purchase Details
Closed on
Jul 26, 2010
Sold by
Perry Craig
Bought by
Gonzalez Jose M
Current Estimated Value
Purchase Details
Closed on
Jun 7, 2010
Sold by
Citimortgage Inc
Bought by
Perry Craig
Purchase Details
Closed on
May 3, 2010
Sold by
Spence Timothy J
Bought by
Citimortgage Inc
Purchase Details
Closed on
Jan 5, 1998
Sold by
Spence Timothy Joe
Bought by
Spence Timothy J
Home Financials for this Owner
Home Financials are based on the most recent Mortgage that was taken out on this home.
Original Mortgage
$31,800
Interest Rate
7.2%
Purchase Details
Closed on
Oct 8, 1997
Sold by
Wilhoite James Henry
Bought by
Warren James R and Warren Joann
Home Financials for this Owner
Home Financials are based on the most recent Mortgage that was taken out on this home.
Original Mortgage
$20,025
Interest Rate
7.46%
Purchase Details
Closed on
Oct 12, 1984
Bought by
Wilhoite James Henry and Wilhoite Anna J
Create a Home Valuation Report for This Property
The Home Valuation Report is an in-depth analysis detailing your home's value as well as a comparison with similar homes in the area
Home Values in the Area
Average Home Value in this Area
Purchase History
| Date | Buyer | Sale Price | Title Company |
|---|---|---|---|
| Gonzalez Jose M | $32,500 | -- | |
| Perry Craig | $20,100 | -- | |
| Citimortgage Inc | $21,613 | -- | |
| Spence Timothy J | $31,800 | -- | |
| Warren James R | $51,500 | -- | |
| Wilhoite James Henry | -- | -- |
Source: Public Records
Mortgage History
| Date | Status | Borrower | Loan Amount |
|---|---|---|---|
| Previous Owner | Wilhoite James Henry | $31,800 | |
| Previous Owner | Wilhoite James Henry | $20,025 |
Source: Public Records
Tax History Compared to Growth
Tax History
| Year | Tax Paid | Tax Assessment Tax Assessment Total Assessment is a certain percentage of the fair market value that is determined by local assessors to be the total taxable value of land and additions on the property. | Land | Improvement |
|---|---|---|---|---|
| 2025 | -- | $13,625 | $0 | $0 |
| 2024 | -- | $13,625 | $4,050 | $9,575 |
| 2023 | $519 | $13,625 | $4,050 | $9,575 |
| 2022 | $534 | $13,625 | $4,050 | $9,575 |
| 2021 | $485 | $13,625 | $4,050 | $9,575 |
| 2020 | $392 | $13,625 | $4,050 | $9,575 |
| 2019 | $392 | $8,850 | $3,000 | $5,850 |
| 2018 | $384 | $8,850 | $3,000 | $5,850 |
| 2017 | $384 | $8,850 | $3,000 | $5,850 |
| 2016 | $380 | $8,850 | $3,000 | $5,850 |
| 2015 | $380 | $8,850 | $3,000 | $5,850 |
| 2014 | $334 | $8,526 | $0 | $0 |
Source: Public Records
Map
Nearby Homes
- 2290 Midland Rd Unit 7A
- 2290 Midland Rd Unit 8B
- 2290 Midland Rd Unit 4A
- 1931 Tennessee 82
- 2315 U S 231
- 3124 U S 231
- 0 Hwy 231 N
- 108 Thoroughbred Blvd
- 1525 Green Ln
- 1523 Green Ln
- 1507 Green Ln
- 321 Rolling Rd
- 1505 Green Ln
- 323 Rolling Rd
- 201 Hickory Dr
- 118 Hidden
- 116 Hidden
- 114 Hidden
- 112 Hidden
- 318 Meadow Dr
- 108 Alta Ave
- 104 Alta Ave
- 2106 Springdale Ave
- 2010 Springdale Ave
- 2103 Springdale Ave
- 2108 Springdale Ave
- 2101 N Main St
- 2105 Springdale Ave
- 2101 Springdale Ave
- 2107 Springdale Ave
- 2013 N Main St
- 2290 Midland Rd Unit 6B
- 2290 Midland Rd Unit 6A
- 2290 Midland Rd Unit 2C
- 2290 Midland Rd Unit 2B
- 2290 Midland Rd Unit 2A
- 2290 Midland Rd Unit 3A
- 2290 Midland Rd Unit 1B
- 2011 Springdale Ave
- 2110 Springdale Ave