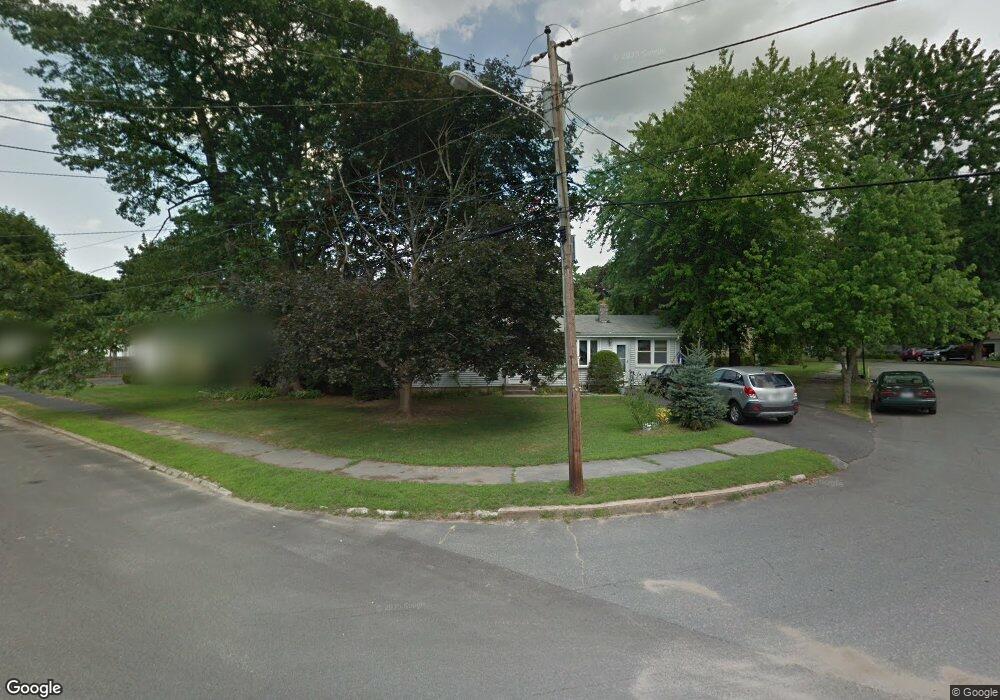
106 Amanda St Cranston, RI 02920
Oaklawn NeighborhoodEstimated Value: $432,000 - $483,000
3
Beds
2
Baths
1,248
Sq Ft
$362/Sq Ft
Est. Value
About This Home
This home is located at 106 Amanda St, Cranston, RI 02920 and is currently estimated at $451,899, approximately $362 per square foot. 106 Amanda St is a home located in Providence County with nearby schools including Oak Lawn School, Western Hills Middle School, and Cranston High School West.
Ownership History
Date
Name
Owned For
Owner Type
Purchase Details
Closed on
Dec 28, 1992
Sold by
Day Steven G and Day Patricia
Bought by
Fargnoli Victor P and Fargnoli James
Current Estimated Value
Home Financials for this Owner
Home Financials are based on the most recent Mortgage that was taken out on this home.
Original Mortgage
$95,000
Interest Rate
8.31%
Create a Home Valuation Report for This Property
The Home Valuation Report is an in-depth analysis detailing your home's value as well as a comparison with similar homes in the area
Home Values in the Area
Average Home Value in this Area
Purchase History
| Date | Buyer | Sale Price | Title Company |
|---|---|---|---|
| Fargnoli Victor P | $100,000 | -- |
Source: Public Records
Mortgage History
| Date | Status | Borrower | Loan Amount |
|---|---|---|---|
| Open | Fargnoli Victor P | $25,332 | |
| Open | Fargnoli Victor P | $190,000 | |
| Closed | Fargnoli Victor P | $180,000 | |
| Closed | Fargnoli Victor P | $95,000 |
Source: Public Records
Tax History Compared to Growth
Tax History
| Year | Tax Paid | Tax Assessment Tax Assessment Total Assessment is a certain percentage of the fair market value that is determined by local assessors to be the total taxable value of land and additions on the property. | Land | Improvement |
|---|---|---|---|---|
| 2025 | $4,958 | $357,200 | $112,300 | $244,900 |
| 2024 | $4,861 | $357,200 | $112,300 | $244,900 |
| 2023 | $4,595 | $243,100 | $73,900 | $169,200 |
| 2022 | $4,500 | $243,100 | $73,900 | $169,200 |
| 2021 | $4,376 | $243,100 | $73,900 | $169,200 |
| 2020 | $4,139 | $199,300 | $70,400 | $128,900 |
| 2019 | $4,139 | $199,300 | $70,400 | $128,900 |
| 2018 | $4,044 | $199,300 | $70,400 | $128,900 |
| 2017 | $3,971 | $173,100 | $63,400 | $109,700 |
| 2016 | $3,886 | $173,100 | $63,400 | $109,700 |
| 2015 | $3,886 | $173,100 | $63,400 | $109,700 |
| 2014 | $3,675 | $160,900 | $63,400 | $97,500 |
Source: Public Records
Map
Nearby Homes
- 61 Rose Hill Dr
- 25 Stoneham St
- 91 Ridgeway Rd
- 46 Hornbeam Dr
- 37 Carriage Rd
- 11 Chaple Dr
- 20 Manilla Ave
- 16 Flynn Ave
- 112 Greenwich Ave
- 269 Glen Hills Dr
- 16 Eastman St
- 14 W Natick Rd
- 61 Crossland Rd
- 10 East St Unit 316
- 71 Steven Dr
- 33 Samuel Ct
- 2 Honeysuckle Dr
- 0 Natick Rd
- 54 River St Unit 4
- 63 Governors Hill Unit 63