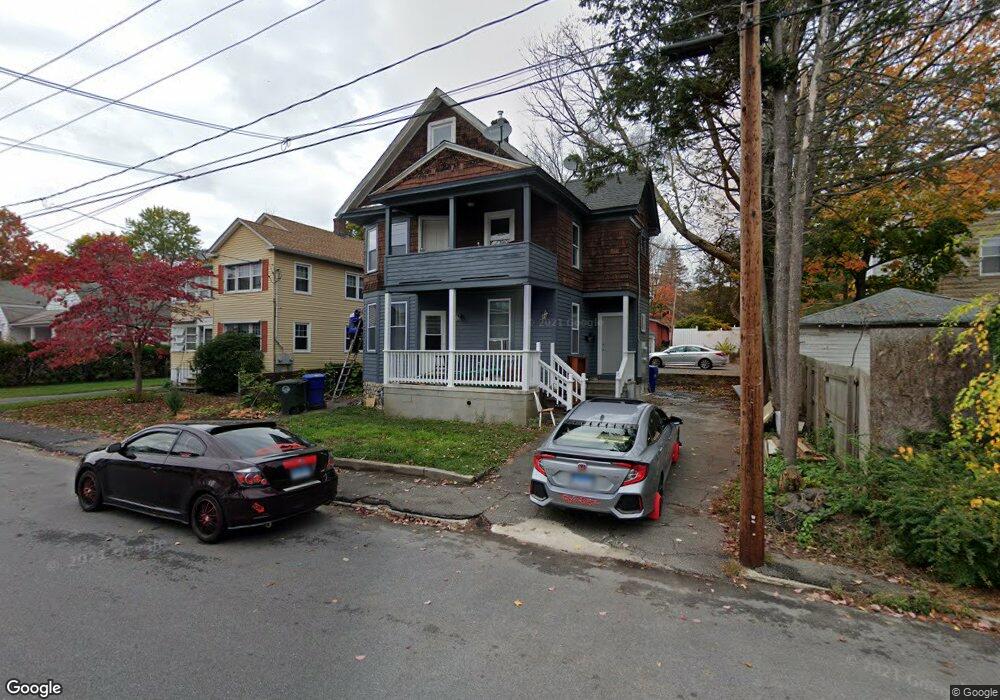
106 Berry St Torrington, CT 06790
Estimated Value: $239,761 - $322,000
6
Beds
2
Baths
2,041
Sq Ft
$140/Sq Ft
Est. Value
About This Home
This home is located at 106 Berry St, Torrington, CT 06790 and is currently estimated at $284,940, approximately $139 per square foot. 106 Berry St is a home located in Litchfield County with nearby schools including Torrington Middle School, Torrington High School, and St. John Paul the Great Academy.
Ownership History
Date
Name
Owned For
Owner Type
Purchase Details
Closed on
Dec 31, 2018
Sold by
Tacuri Luis B
Bought by
Tapia Carlos B
Current Estimated Value
Purchase Details
Closed on
Jul 3, 2018
Sold by
Bentley Bonita L
Bought by
Barrere-Tacuri Luis
Purchase Details
Closed on
Aug 18, 1999
Sold by
Kunkiewicz Richard
Bought by
Bentley Bonnita L
Home Financials for this Owner
Home Financials are based on the most recent Mortgage that was taken out on this home.
Original Mortgage
$36,226
Interest Rate
7.6%
Create a Home Valuation Report for This Property
The Home Valuation Report is an in-depth analysis detailing your home's value as well as a comparison with similar homes in the area
Home Values in the Area
Average Home Value in this Area
Purchase History
| Date | Buyer | Sale Price | Title Company |
|---|---|---|---|
| Tapia Carlos B | -- | -- | |
| Barrere-Tacuri Luis | $19,930 | -- | |
| Bentley Bonnita L | $42,000 | -- |
Source: Public Records
Mortgage History
| Date | Status | Borrower | Loan Amount |
|---|---|---|---|
| Previous Owner | Bentley Bonnita L | $36,226 |
Source: Public Records
Tax History
| Year | Tax Paid | Tax Assessment Tax Assessment Total Assessment is a certain percentage of the fair market value that is determined by local assessors to be the total taxable value of land and additions on the property. | Land | Improvement |
|---|---|---|---|---|
| 2025 | $6,225 | $161,910 | $19,320 | $142,590 |
| 2024 | $3,357 | $69,990 | $19,320 | $50,670 |
| 2023 | $3,357 | $69,990 | $19,320 | $50,670 |
| 2022 | $3,299 | $69,990 | $19,320 | $50,670 |
| 2021 | $3,231 | $69,990 | $19,320 | $50,670 |
| 2020 | $3,231 | $69,990 | $19,320 | $50,670 |
| 2019 | $2,337 | $50,620 | $19,320 | $31,300 |
| 2018 | $2,337 | $50,620 | $19,320 | $31,300 |
| 2017 | $2,316 | $50,620 | $19,320 | $31,300 |
| 2016 | $2,316 | $50,620 | $19,320 | $31,300 |
| 2015 | $2,316 | $50,620 | $19,320 | $31,300 |
| 2014 | $1,312 | $36,120 | $23,520 | $12,600 |
Source: Public Records
Map
Nearby Homes
- 42 Pulver St
- 0 Red Mountain Ave
- 329 Church St
- 80 Washington Ave
- 118 Pearl St
- 47 Whiting Ave
- 115 Beechwood Ave
- 130 N Elm St
- 0 Highland Ave Unit 24088105
- 00 Church St
- 116 High St
- 146 Beechwood Ave
- 163 Beechwood Ave
- 444 Prospect St
- 30 Culvert St
- 108 Culvert St
- 95 Colorado Ave N
- 408 Main St
- 00 Winthrop St & E Elm St
- 682 Main St
Your Personal Tour Guide
Ask me questions while you tour the home.