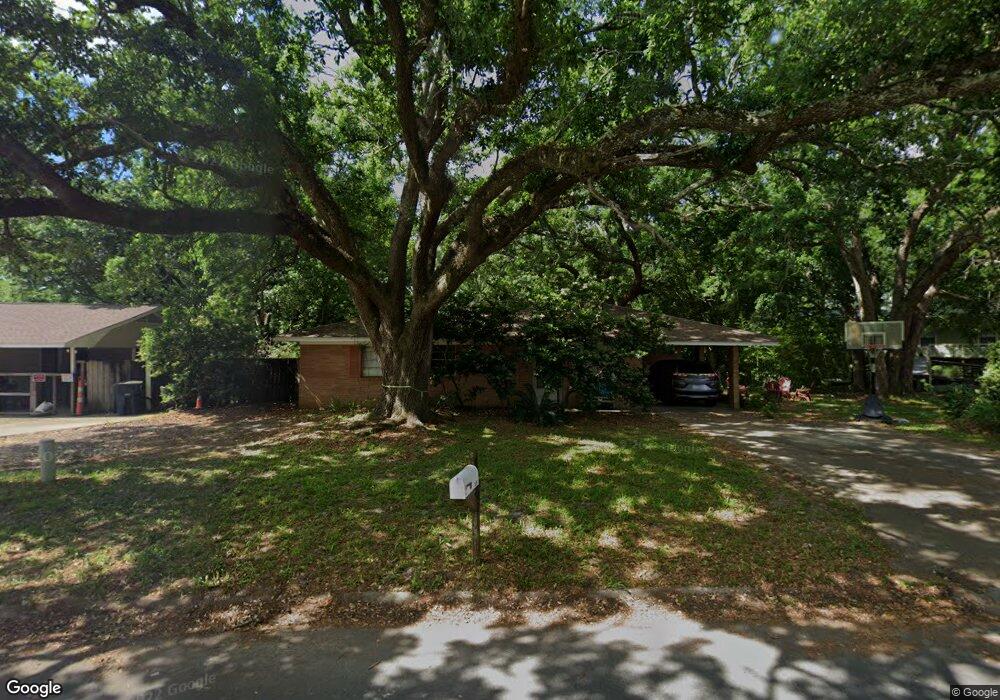
106 Bryant St Ocean Springs, MS 39564
Estimated Value: $172,000 - $179,760
3
Beds
2
Baths
1,026
Sq Ft
$171/Sq Ft
Est. Value
About This Home
This home is located at 106 Bryant St, Ocean Springs, MS 39564 and is currently estimated at $175,440, approximately $170 per square foot. 106 Bryant St is a home located in Jackson County with nearby schools including Magnolia Park Elementary School, Ocean Springs Middle School, and Ocean Springs High School.
Ownership History
Date
Name
Owned For
Owner Type
Purchase Details
Closed on
Apr 8, 2022
Sold by
Scott Gallagher Brian and Scott Renee Monica
Bought by
Brian And Monica Gallagher Llc
Current Estimated Value
Purchase Details
Closed on
Jul 13, 2019
Sold by
Russell Joann D
Bought by
T William
Purchase Details
Closed on
Dec 21, 2017
Sold by
Monique-Rigdon Franches
Bought by
Russell Joann D
Purchase Details
Closed on
Nov 1, 2017
Sold by
Russell Joann D
Bought by
Rigdon Frances Monique and Russell Joann D
Create a Home Valuation Report for This Property
The Home Valuation Report is an in-depth analysis detailing your home's value as well as a comparison with similar homes in the area
Home Values in the Area
Average Home Value in this Area
Purchase History
| Date | Buyer | Sale Price | Title Company |
|---|---|---|---|
| Brian And Monica Gallagher Llc | -- | Zuber Henry B | |
| T William | -- | -- | |
| Russell Joann D | -- | -- | |
| Rigdon Frances Monique | -- | None Available |
Source: Public Records
Tax History Compared to Growth
Tax History
| Year | Tax Paid | Tax Assessment Tax Assessment Total Assessment is a certain percentage of the fair market value that is determined by local assessors to be the total taxable value of land and additions on the property. | Land | Improvement |
|---|---|---|---|---|
| 2024 | $1,442 | $10,008 | $2,684 | $7,324 |
| 2023 | $1,442 | $10,008 | $2,684 | $7,324 |
| 2022 | $1,461 | $10,007 | $0 | $0 |
| 2021 | $1,453 | $10,090 | $2,684 | $7,406 |
| 2020 | $1,140 | $7,838 | $2,195 | $5,643 |
| 2019 | $0 | $5,225 | $1,463 | $3,762 |
| 2018 | $377 | $5,225 | $1,463 | $3,762 |
| 2017 | $0 | $5,225 | $1,463 | $3,762 |
| 2016 | $0 | $5,225 | $1,463 | $3,762 |
| 2015 | -- | $43,870 | $14,630 | $29,240 |
| 2014 | -- | $4,201 | $1,463 | $2,738 |
| 2013 | -- | $6,263 | $1,987 | $4,276 |
Source: Public Records
Map
Nearby Homes