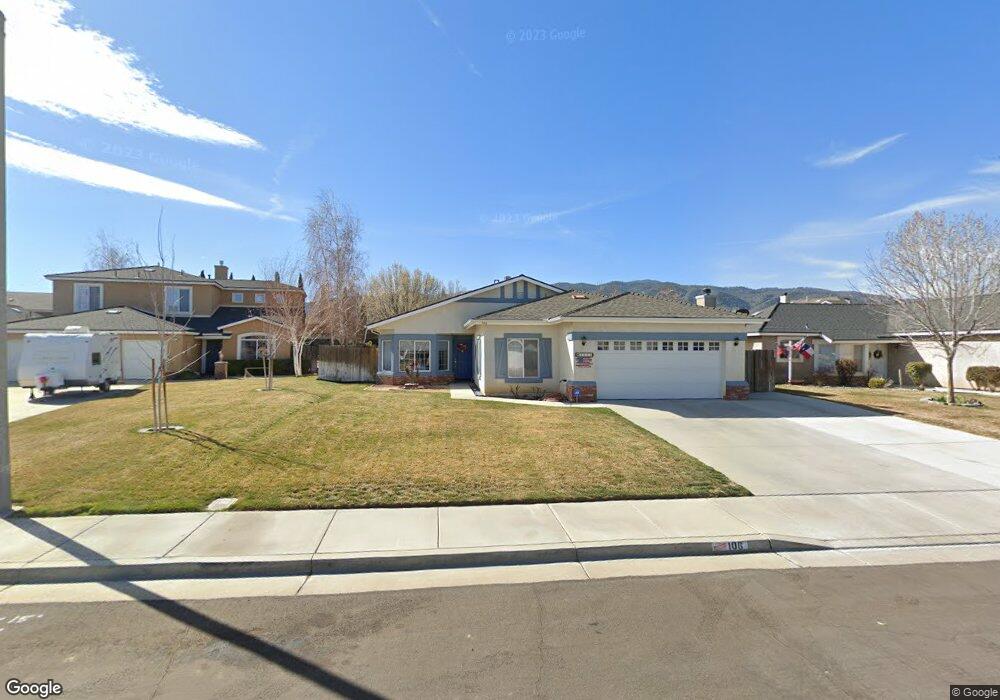
106 Clearview Ct Tehachapi, CA 93561
Estimated Value: $411,000 - $451,000
4
Beds
2
Baths
1,704
Sq Ft
$250/Sq Ft
Est. Value
About This Home
This home is located at 106 Clearview Ct, Tehachapi, CA 93561 and is currently estimated at $426,516, approximately $250 per square foot. 106 Clearview Ct is a home located in Kern County with nearby schools including Tompkins Elementary School, Jacobsen Middle School, and Tehachapi High School.
Ownership History
Date
Name
Owned For
Owner Type
Purchase Details
Closed on
Apr 25, 2005
Sold by
Pannon Homes 6212 Llc
Bought by
King Charles R
Current Estimated Value
Create a Home Valuation Report for This Property
The Home Valuation Report is an in-depth analysis detailing your home's value as well as a comparison with similar homes in the area
Home Values in the Area
Average Home Value in this Area
Purchase History
| Date | Buyer | Sale Price | Title Company |
|---|---|---|---|
| King Charles R | $251,500 | Chicago Title |
Source: Public Records
Tax History
| Year | Tax Paid | Tax Assessment Tax Assessment Total Assessment is a certain percentage of the fair market value that is determined by local assessors to be the total taxable value of land and additions on the property. | Land | Improvement |
|---|---|---|---|---|
| 2025 | $4,036 | $309,968 | $55,175 | $254,793 |
| 2024 | $3,732 | $303,892 | $54,094 | $249,798 |
| 2023 | $3,732 | $297,934 | $53,034 | $244,900 |
| 2022 | $3,666 | $292,094 | $51,995 | $240,099 |
| 2021 | $3,620 | $286,368 | $50,976 | $235,392 |
| 2020 | $3,602 | $281,000 | $70,000 | $211,000 |
| 2019 | $3,514 | $269,000 | $67,000 | $202,000 |
| 2018 | $3,235 | $251,000 | $63,000 | $188,000 |
| 2017 | $3,122 | $238,000 | $60,000 | $178,000 |
| 2016 | $2,859 | $218,000 | $55,000 | $163,000 |
| 2015 | $2,697 | $210,000 | $53,000 | $157,000 |
| 2014 | $2,115 | $162,000 | $41,000 | $121,000 |
Source: Public Records
Map
Nearby Homes
- 114 Clearview Ct
- 824 S Green St
- 814 S Green St
- 110 Clearview Ct
- 820 S Green St
- 117 Brentwood Dr
- 828 S Green St
- 115 Brentwood Dr
- 119 Brentwood Dr
- 107 Clearview Ct
- 115 Clearview Ct
- 103 Clearview Ct
- 111 Clearview Ct
- 806 S Green St
- 832 S Green St
- 122 Clearview Ct
- 123 Clearview Ct
- 818 S Green St
- 802 S Green St
- 119 Clearview Ct
Your Personal Tour Guide
Ask me questions while you tour the home.