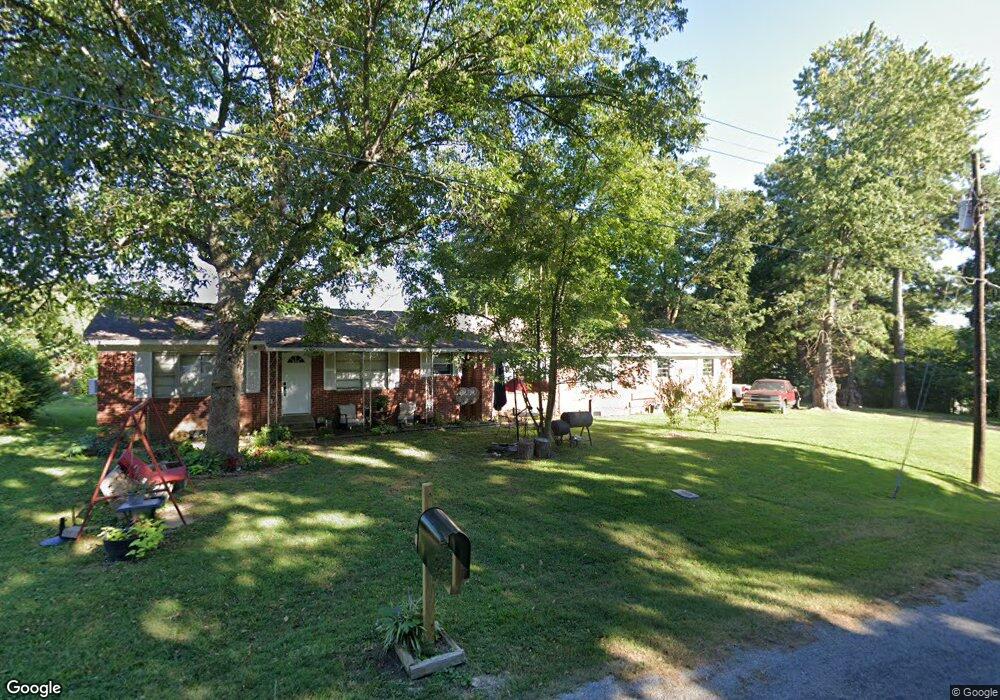
106 Curve Nankipoo Spur Rd Ripley, TN 38063
Estimated Value: $150,000 - $175,000
--
Bed
2
Baths
1,634
Sq Ft
$101/Sq Ft
Est. Value
About This Home
This home is located at 106 Curve Nankipoo Spur Rd, Ripley, TN 38063 and is currently estimated at $165,619, approximately $101 per square foot. 106 Curve Nankipoo Spur Rd is a home located in Lauderdale County with nearby schools including Halls Elementary School, Halls Junior High School, and Halls High School.
Ownership History
Date
Name
Owned For
Owner Type
Purchase Details
Closed on
Oct 24, 2006
Sold by
Terry Dunaway
Bought by
King Eddie B
Current Estimated Value
Home Financials for this Owner
Home Financials are based on the most recent Mortgage that was taken out on this home.
Original Mortgage
$82,530
Outstanding Balance
$56,336
Interest Rate
9.24%
Mortgage Type
Cash
Estimated Equity
$109,283
Purchase Details
Closed on
Oct 15, 2005
Sold by
Jimmy Jackson
Bought by
Terry Dunaway
Home Financials for this Owner
Home Financials are based on the most recent Mortgage that was taken out on this home.
Original Mortgage
$55,360
Interest Rate
7.63%
Mortgage Type
Cash
Purchase Details
Closed on
Oct 15, 2004
Bought by
Dunaway Terry and Dunaway Shawnta
Purchase Details
Closed on
Sep 21, 1999
Sold by
Jackson L E L and Jackson Willie
Bought by
Carolyn Jackson
Purchase Details
Closed on
Aug 13, 1983
Bought by
Jackson Jackson L and Jackson Willie
Purchase Details
Closed on
Jan 22, 1977
Create a Home Valuation Report for This Property
The Home Valuation Report is an in-depth analysis detailing your home's value as well as a comparison with similar homes in the area
Home Values in the Area
Average Home Value in this Area
Purchase History
| Date | Buyer | Sale Price | Title Company |
|---|---|---|---|
| King Eddie B | $91,700 | -- | |
| Terry Dunaway | $69,200 | -- | |
| Dunaway Terry | $69,200 | -- | |
| Carolyn Jackson | $2,000 | -- | |
| Jackson Jackson L | -- | -- | |
| -- | -- | -- |
Source: Public Records
Mortgage History
| Date | Status | Borrower | Loan Amount |
|---|---|---|---|
| Open | Not Available | $82,530 | |
| Previous Owner | Not Available | $55,360 |
Source: Public Records
Tax History Compared to Growth
Tax History
| Year | Tax Paid | Tax Assessment Tax Assessment Total Assessment is a certain percentage of the fair market value that is determined by local assessors to be the total taxable value of land and additions on the property. | Land | Improvement |
|---|---|---|---|---|
| 2025 | $549 | $21,625 | $0 | $0 |
| 2024 | $549 | $21,625 | $1,175 | $20,450 |
| 2023 | $549 | $21,625 | $1,175 | $20,450 |
| 2022 | $549 | $21,625 | $1,175 | $20,450 |
| 2021 | $549 | $21,625 | $1,175 | $20,450 |
| 2020 | $561 | $21,625 | $1,175 | $20,450 |
| 2019 | $561 | $18,975 | $1,475 | $17,500 |
| 2018 | $561 | $18,975 | $1,475 | $17,500 |
| 2017 | $564 | $18,975 | $1,475 | $17,500 |
| 2016 | $564 | $18,975 | $1,475 | $17,500 |
| 2015 | $609 | $18,975 | $1,475 | $17,500 |
| 2014 | $609 | $21,000 | $1,475 | $19,525 |
Source: Public Records
Map
Nearby Homes
- 302 Ford Store Rd
- 421 Curve Woodville Rd
- 426 Curve Woodville Rd
- 127 Harvey Newman Rd
- 622 Bluebird Hill Rd
- 000 Bluebird Hill Rd
- 2656 Curve Woodville Rd
- 176 Roy Crain Rd
- 0 Dry Hill Rd E
- 5720 Conner Whitefield Rd
- 000 Dry Hill Rd E
- 4765 Conner Whitefield Rd
- 2631 Highway 51 N
- 35 Ellis Loop
- 0 Floyd Akin Rd
- 390 Emerson Rd
- 333 Wardlow St W
- 71 4th St
- 0 Edith Nankipoo Rd Unit 10200861
- 1216 Cedar Grove Ext Rd
- 72 Curve Nankipoo Spur Rd
- 120 Curve Nankipoo Spur Rd
- 71 Curve Nankipoo Spur Rd
- 6125 Highway 209 N
- 6125 Tennessee 209
- 6145 Highway 209 N
- 37 Curve Nankipoo Spur Rd
- 0 Ford Store Rd Unit 9998047
- 6054 Highway 209 N
- 6054 Tennessee 209
- 351 Curve Nankipoo Rd
- 6169 Highway 209 N
- 6118 Highway 209 N
- 289 Curve Nankipoo Rd
- 305 Curve Nankipoo Rd
- 382 Curve Nankipoo Rd
- 6148 Highway 209 N
- 501 Curve Nankipoo Rd
- 279 Curve Nankipoo Rd
- 6205 Highway 209 N