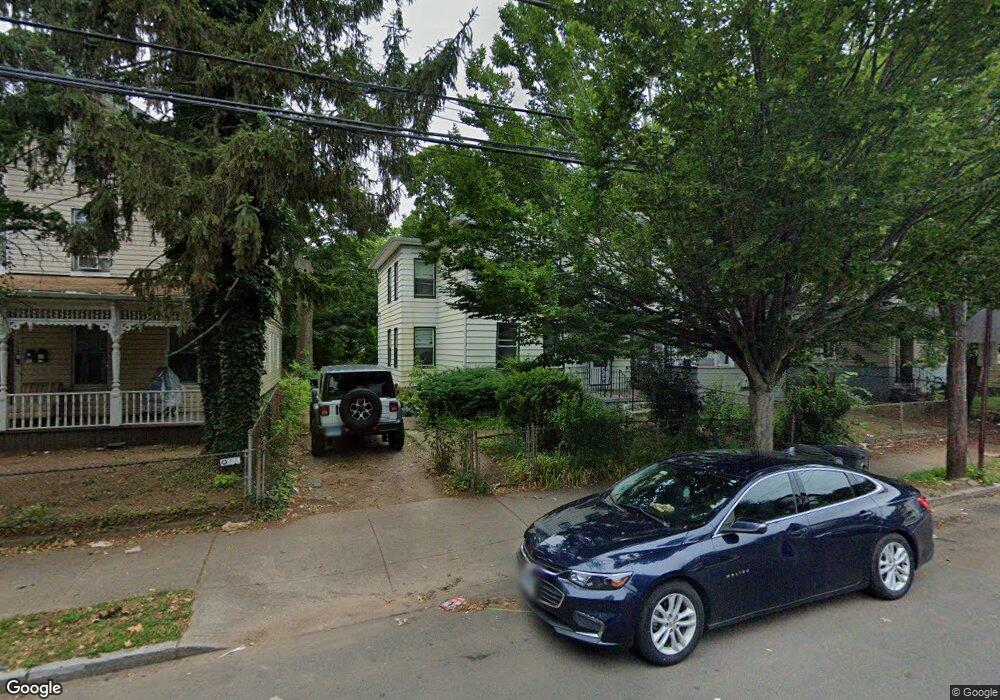
106 Dewitt St New Haven, CT 06519
The Hill NeighborhoodEstimated Value: $241,413 - $311,000
4
Beds
2
Baths
1,984
Sq Ft
$139/Sq Ft
Est. Value
About This Home
This home is located at 106 Dewitt St, New Haven, CT 06519 and is currently estimated at $275,853, approximately $139 per square foot. 106 Dewitt St is a home located in New Haven County with nearby schools including John C. Daniels and St Martin De Porres Academy.
Ownership History
Date
Name
Owned For
Owner Type
Purchase Details
Closed on
Dec 18, 2020
Sold by
Real Estate Group 12 Llc
Bought by
Real Estate Group 12 De
Current Estimated Value
Home Financials for this Owner
Home Financials are based on the most recent Mortgage that was taken out on this home.
Original Mortgage
$4,358,000
Outstanding Balance
$154,933
Interest Rate
2.7%
Mortgage Type
Stand Alone Refi Refinance Of Original Loan
Estimated Equity
$120,920
Purchase Details
Closed on
Jul 29, 2019
Sold by
Bland William O
Bought by
Real Estate Group 12 Llc
Purchase Details
Closed on
Dec 24, 1973
Bought by
Bland William O and Bland Patricia A
Create a Home Valuation Report for This Property
The Home Valuation Report is an in-depth analysis detailing your home's value as well as a comparison with similar homes in the area
Home Values in the Area
Average Home Value in this Area
Purchase History
| Date | Buyer | Sale Price | Title Company |
|---|---|---|---|
| Real Estate Group 12 De | -- | None Available | |
| Real Estate Group 12 Llc | $50,000 | -- | |
| Bland William O | -- | -- |
Source: Public Records
Mortgage History
| Date | Status | Borrower | Loan Amount |
|---|---|---|---|
| Open | Real Estate Group 12 De | $4,358,000 |
Source: Public Records
Tax History
| Year | Tax Paid | Tax Assessment Tax Assessment Total Assessment is a certain percentage of the fair market value that is determined by local assessors to be the total taxable value of land and additions on the property. | Land | Improvement |
|---|---|---|---|---|
| 2025 | $4,173 | $105,910 | $24,010 | $81,900 |
| 2024 | $4,078 | $105,910 | $24,010 | $81,900 |
| 2023 | $3,940 | $105,910 | $24,010 | $81,900 |
| 2022 | $4,210 | $105,910 | $24,010 | $81,900 |
| 2021 | $2,725 | $62,090 | $20,650 | $41,440 |
| 2020 | $2,725 | $62,090 | $20,650 | $41,440 |
| 2019 | $2,669 | $62,090 | $20,650 | $41,440 |
| 2018 | $2,669 | $62,090 | $20,650 | $41,440 |
| 2017 | $2,402 | $62,090 | $20,650 | $41,440 |
| 2016 | $1,949 | $46,900 | $11,830 | $35,070 |
| 2015 | $1,949 | $46,900 | $11,830 | $35,070 |
| 2014 | $1,949 | $46,900 | $11,830 | $35,070 |
Source: Public Records
Map
Nearby Homes
Your Personal Tour Guide
Ask me questions while you tour the home.