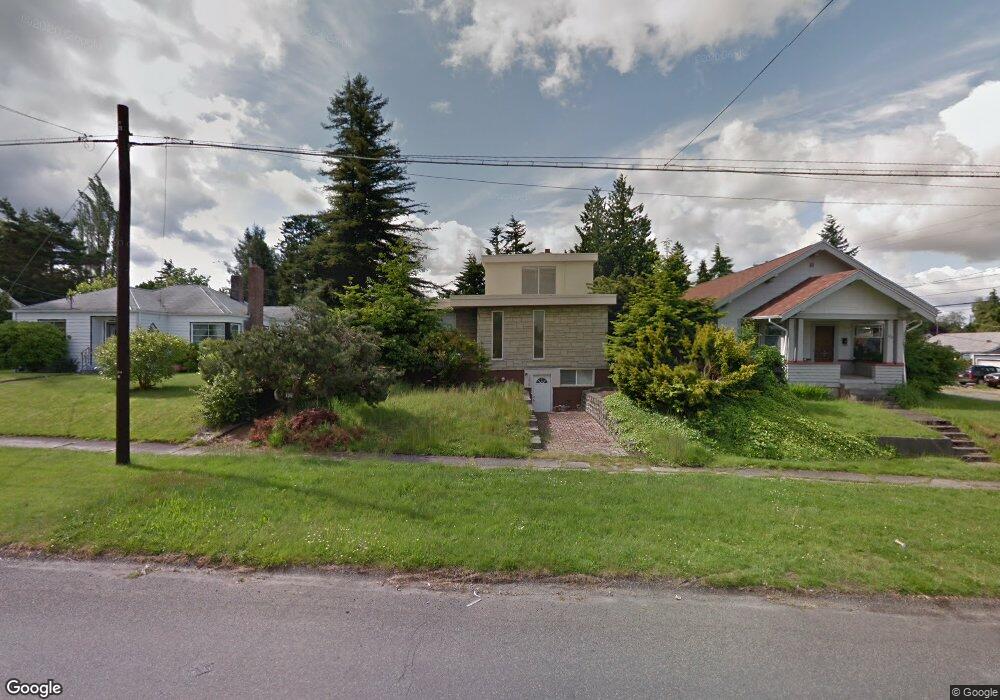
106 E 64th St Unit A Tacoma, WA 98404
Eastside NeighborhoodEstimated Value: $542,000 - $623,000
4
Beds
2
Baths
1,902
Sq Ft
$314/Sq Ft
Est. Value
About This Home
This home is located at 106 E 64th St Unit A, Tacoma, WA 98404 and is currently estimated at $597,293, approximately $314 per square foot. 106 E 64th St Unit A is a home located in Pierce County with nearby schools including Oakland High School, Hunt Middle School, and Mount Tahoma High School.
Ownership History
Date
Name
Owned For
Owner Type
Purchase Details
Closed on
Oct 18, 2021
Sold by
Nguyen Loc Phuoc
Bought by
Nguyen Tina
Current Estimated Value
Home Financials for this Owner
Home Financials are based on the most recent Mortgage that was taken out on this home.
Original Mortgage
$460,000
Outstanding Balance
$419,477
Interest Rate
2.8%
Mortgage Type
New Conventional
Estimated Equity
$177,816
Purchase Details
Closed on
Oct 8, 2021
Sold by
Brackman Carol and Schmitt John
Bought by
Nguyen Tina
Home Financials for this Owner
Home Financials are based on the most recent Mortgage that was taken out on this home.
Original Mortgage
$460,000
Outstanding Balance
$419,477
Interest Rate
2.8%
Mortgage Type
New Conventional
Estimated Equity
$177,816
Purchase Details
Closed on
Oct 5, 2018
Sold by
Do Sam
Bought by
Brackman Carol and Schmitt John
Home Financials for this Owner
Home Financials are based on the most recent Mortgage that was taken out on this home.
Original Mortgage
$172,500
Interest Rate
4.6%
Mortgage Type
New Conventional
Purchase Details
Closed on
Jul 6, 2016
Sold by
Slomczykowski Irek J and Slomczykowski Irena M
Bought by
Do San
Home Financials for this Owner
Home Financials are based on the most recent Mortgage that was taken out on this home.
Original Mortgage
$204,800
Interest Rate
3.6%
Mortgage Type
New Conventional
Purchase Details
Closed on
Sep 12, 2005
Sold by
Thomas Jerry C and Thomas Marilyn M
Bought by
Slomczykowski Irek J and Slomczykowski Irena M
Home Financials for this Owner
Home Financials are based on the most recent Mortgage that was taken out on this home.
Original Mortgage
$154,800
Interest Rate
5.81%
Mortgage Type
Fannie Mae Freddie Mac
Purchase Details
Closed on
Aug 5, 2004
Sold by
Thomas Marilyn
Bought by
Thomas Jerry
Home Financials for this Owner
Home Financials are based on the most recent Mortgage that was taken out on this home.
Original Mortgage
$150,800
Interest Rate
7%
Mortgage Type
Purchase Money Mortgage
Create a Home Valuation Report for This Property
The Home Valuation Report is an in-depth analysis detailing your home's value as well as a comparison with similar homes in the area
Home Values in the Area
Average Home Value in this Area
Purchase History
| Date | Buyer | Sale Price | Title Company |
|---|---|---|---|
| Nguyen Tina | -- | First American Title | |
| Nguyen Tina | $575,000 | First American Title | |
| Brackman Carol | $344,719 | Chicago Title | |
| Do San | $255,719 | Stewart Title Company | |
| Slomczykowski Irek J | $193,500 | First American Title Ins Co | |
| Thomas Jerry | -- | First American Title Ins Co | |
| Thomas Jerry | $188,500 | First American Title Ins Co |
Source: Public Records
Mortgage History
| Date | Status | Borrower | Loan Amount |
|---|---|---|---|
| Open | Nguyen Tina | $460,000 | |
| Closed | Nguyen Tina | $460,000 | |
| Previous Owner | Brackman Carol | $172,500 | |
| Previous Owner | Do San | $204,800 | |
| Previous Owner | Slomczykowski Irek J | $154,800 | |
| Previous Owner | Thomas Jerry | $150,800 | |
| Closed | Thomas Jerry | $37,700 |
Source: Public Records
Tax History
| Year | Tax Paid | Tax Assessment Tax Assessment Total Assessment is a certain percentage of the fair market value that is determined by local assessors to be the total taxable value of land and additions on the property. | Land | Improvement |
|---|---|---|---|---|
| 2025 | $5,891 | $601,400 | $182,100 | $419,300 |
| 2024 | $5,891 | $568,600 | $175,400 | $393,200 |
| 2023 | $5,891 | $529,300 | $167,100 | $362,200 |
| 2022 | $5,680 | $580,800 | $155,100 | $425,700 |
| 2021 | $5,261 | $418,700 | $98,800 | $319,900 |
| 2019 | $4,563 | $384,300 | $81,600 | $302,700 |
| 2018 | $4,769 | $351,200 | $66,100 | $285,100 |
| 2017 | $4,252 | $302,000 | $52,500 | $249,500 |
| 2016 | $3,687 | $227,100 | $39,300 | $187,800 |
| 2014 | $3,143 | $212,100 | $37,000 | $175,100 |
| 2013 | $3,143 | $185,100 | $32,600 | $152,500 |
Source: Public Records
Map
Nearby Homes
Your Personal Tour Guide
Ask me questions while you tour the home.