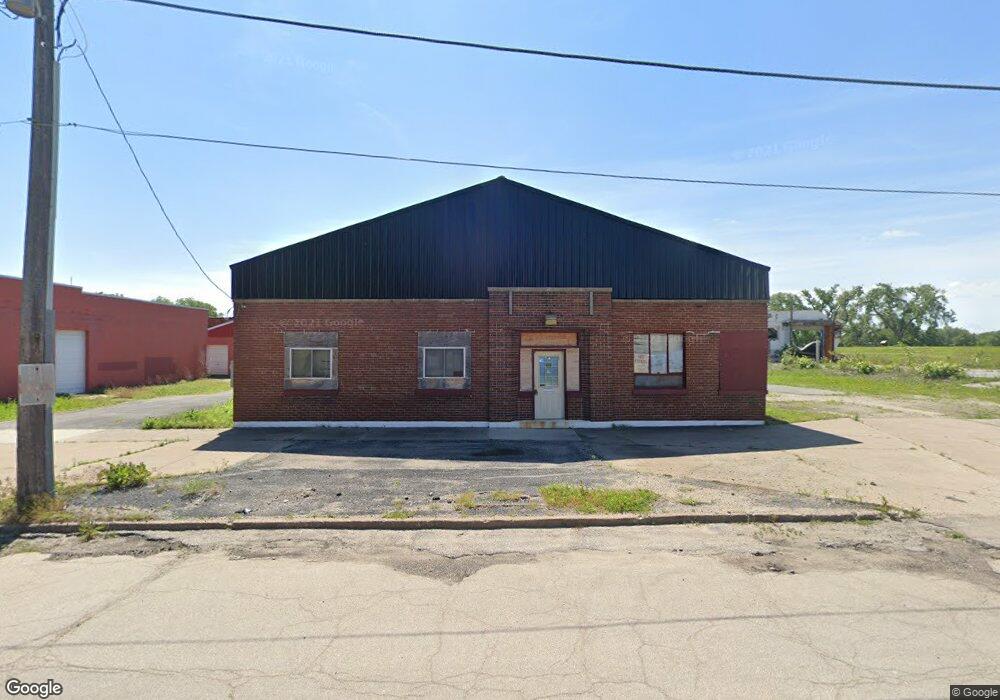
106 E 9th St Unit 2 Waterloo, IA 50703
Cedar River NeighborhoodEstimated Value: $166,502
Studio
--
Bath
4,475
Sq Ft
$37/Sq Ft
Est. Value
About This Home
This home is located at 106 E 9th St Unit 2, Waterloo, IA 50703 and is currently priced at $166,502, approximately $37 per square foot. 106 E 9th St Unit 2 is a home located in Black Hawk County with nearby schools including Lowell Elementary School, Central Middle School, and West High School.
Ownership History
Date
Name
Owned For
Owner Type
Purchase Details
Closed on
Feb 8, 2019
Sold by
Veasley Lekeisha
Bought by
Taylor Michael J and Taylor Sherie M
Current Estimated Value
Home Financials for this Owner
Home Financials are based on the most recent Mortgage that was taken out on this home.
Original Mortgage
$60,000
Outstanding Balance
$52,070
Interest Rate
4.4%
Mortgage Type
New Conventional
Purchase Details
Closed on
Oct 26, 2016
Sold by
Veasley Latoya
Bought by
Veasley Lekeisha
Purchase Details
Closed on
Oct 14, 2011
Sold by
Crystal Distribution Services Inc
Bought by
Walton George
Home Financials for this Owner
Home Financials are based on the most recent Mortgage that was taken out on this home.
Original Mortgage
$40,000
Interest Rate
4.12%
Mortgage Type
Future Advance Clause Open End Mortgage
Create a Home Valuation Report for This Property
The Home Valuation Report is an in-depth analysis detailing your home's value as well as a comparison with similar homes in the area
Home Values in the Area
Average Home Value in this Area
Purchase History
| Date | Buyer | Sale Price | Title Company |
|---|---|---|---|
| Taylor Michael J | $75,000 | -- | |
| Veasley Lekeisha | $31,000 | None Available | |
| Walton George | $40,000 | None Available |
Source: Public Records
Mortgage History
| Date | Status | Borrower | Loan Amount |
|---|---|---|---|
| Open | Taylor Michael J | $60,000 | |
| Previous Owner | Walton George | $40,000 |
Source: Public Records
Tax History
| Year | Tax Paid | Tax Assessment Tax Assessment Total Assessment is a certain percentage of the fair market value that is determined by local assessors to be the total taxable value of land and additions on the property. | Land | Improvement |
|---|---|---|---|---|
| 2025 | $2,036 | $93,860 | $12,130 | $81,730 |
| 2024 | $2,036 | $93,860 | $12,130 | $81,730 |
| 2023 | $1,642 | $93,860 | $12,130 | $81,730 |
| 2022 | $1,598 | $74,780 | $7,280 | $67,500 |
| 2021 | $1,694 | $74,780 | $7,280 | $67,500 |
| 2020 | $2,014 | $74,780 | $7,280 | $67,500 |
| 2019 | $3,332 | $74,780 | $7,280 | $67,500 |
| 2018 | $3,324 | $74,780 | $7,280 | $67,500 |
| 2017 | $2,698 | $74,780 | $7,280 | $67,500 |
| 2016 | $1,696 | $74,780 | $7,280 | $67,500 |
| 2015 | $1,696 | $74,780 | $7,280 | $67,500 |
| 2014 | $1,730 | $74,780 | $7,280 | $67,500 |
Source: Public Records
Map
Nearby Homes
- 911 Lafayette St Unit 913
- 213-223 E 5th St
- 1421 Mulberry St
- 400 Elm St
- 1612 Franklin St
- 510 Courtland St
- 861 Grindstone Cir
- 519 W 9th St
- 1129 South St
- 929 Randolph St
- 701 W 7th St
- 315 Walnut St
- 520 Linden Ave
- 739 W 11th St
- 1927 Lafayette St
- 1912 Sycamore St
- 337 Almond St
- 73 Lafayette St
- 0 Bates St
- 823 Glenwood St
- 106 E 9th St Unit B
- 106 E 9th St Unit A
- 1101 Sycamore St
- 1109 Sycamore St
- 1111 Sycamore St
- 1025 Sycamore St
- 1121 Sycamore St Unit 1123
- 210 E 9th St
- 1119 Sycamore St
- 1202 Sycamore St
- 120 E 8th St Unit 122
- 212 E 9th St
- 204 E 8th St
- 215 E 9th St
- 218 E 9th St
- 215 E 10th St
- 208 E 8th St
- 1106 Lafayette St
- 217 E 10th St
- 214 E 8th St
Your Personal Tour Guide
Ask me questions while you tour the home.