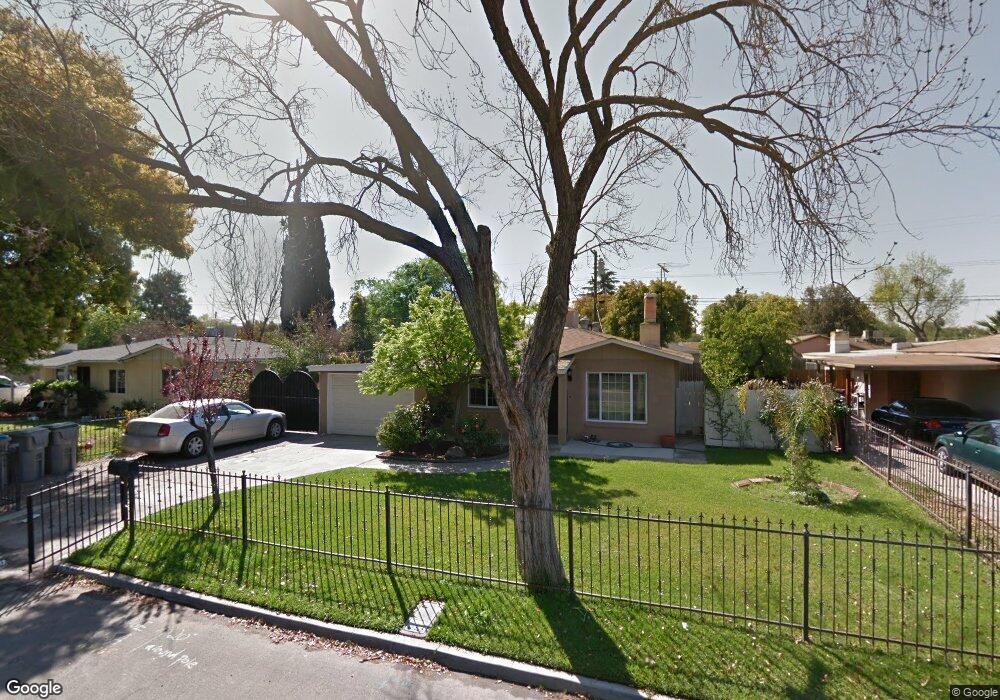
106 E Buckingham Way Fresno, CA 93704
Fig Garden NeighborhoodEstimated Value: $249,000 - $321,000
3
Beds
1
Bath
1,053
Sq Ft
$267/Sq Ft
Est. Value
About This Home
This home is located at 106 E Buckingham Way, Fresno, CA 93704 and is currently estimated at $281,390, approximately $267 per square foot. 106 E Buckingham Way is a home located in Fresno County with nearby schools including Powers-Ginsburg Elementary, Bullard High School, and Endeavor Charter.
Ownership History
Date
Name
Owned For
Owner Type
Purchase Details
Closed on
Dec 8, 2023
Sold by
Gutierrez Deduarte Ana Maria
Bought by
Duarte Salvador Garcia and Duarte Ana Maria
Current Estimated Value
Purchase Details
Closed on
Dec 7, 2023
Sold by
Gutierrez Deduarte Ana Maria
Bought by
Garcia Duarte Salvador and Gutier Duarte Ana
Purchase Details
Closed on
Dec 30, 2003
Sold by
Gutierrez Ana Maria and Lopez Ana G
Bought by
Gutierrez Ana Maria
Home Financials for this Owner
Home Financials are based on the most recent Mortgage that was taken out on this home.
Original Mortgage
$25,000
Interest Rate
6.02%
Mortgage Type
New Conventional
Purchase Details
Closed on
Jul 20, 1995
Sold by
Lopez Ana G and Gutierrez Luis
Bought by
Lopez Ana G
Purchase Details
Closed on
Oct 6, 1993
Sold by
Barker Lloyd and Barker Marie
Bought by
Lopez Ana G and Gutierrez Luis
Home Financials for this Owner
Home Financials are based on the most recent Mortgage that was taken out on this home.
Original Mortgage
$59,379
Interest Rate
7.09%
Mortgage Type
FHA
Create a Home Valuation Report for This Property
The Home Valuation Report is an in-depth analysis detailing your home's value as well as a comparison with similar homes in the area
Home Values in the Area
Average Home Value in this Area
Purchase History
| Date | Buyer | Sale Price | Title Company |
|---|---|---|---|
| Duarte Salvador Garcia | -- | None Listed On Document | |
| Garcia Duarte Salvador | -- | None Listed On Document | |
| Gutierrez Ana Maria | -- | Chicago Title Company | |
| Lopez Ana G | -- | -- | |
| Lopez Ana G | $59,000 | Central Title Company |
Source: Public Records
Mortgage History
| Date | Status | Borrower | Loan Amount |
|---|---|---|---|
| Previous Owner | Gutierrez Ana Maria | $25,000 | |
| Previous Owner | Lopez Ana G | $59,379 |
Source: Public Records
Tax History Compared to Growth
Tax History
| Year | Tax Paid | Tax Assessment Tax Assessment Total Assessment is a certain percentage of the fair market value that is determined by local assessors to be the total taxable value of land and additions on the property. | Land | Improvement |
|---|---|---|---|---|
| 2025 | $1,167 | $89,980 | $33,596 | $56,384 |
| 2023 | $1,102 | $86,489 | $32,293 | $54,196 |
| 2022 | $1,087 | $84,794 | $31,660 | $53,134 |
| 2021 | $1,058 | $83,133 | $31,040 | $52,093 |
| 2020 | $1,053 | $82,281 | $30,722 | $51,559 |
| 2019 | $1,013 | $80,669 | $30,120 | $50,549 |
| 2018 | $992 | $79,088 | $29,530 | $49,558 |
| 2017 | $975 | $77,538 | $28,951 | $48,587 |
| 2016 | $943 | $76,019 | $28,384 | $47,635 |
| 2015 | $845 | $74,878 | $27,958 | $46,920 |
| 2014 | $826 | $73,412 | $27,411 | $46,001 |
Source: Public Records
Map
Nearby Homes
- 216 E Ashlan Ave
- 4121 N Palm Ave
- 94 E Sussex Way
- 4175 N Van Ness Blvd
- 4481 N Palm Ave
- 4012 N Wishon Ave
- 625 E Lansing Way
- 3688 N Harrison Ave
- 336 E Gettysburg Ave
- B N Fruit Ave
- 4246 N Holt Ave
- A N Fruit Ave
- 3749 N Fruit Ave Unit A
- 3725 N Fruit Ave Unit B
- 4261 N Holt Ave
- 547 W Gettysburg Ave
- 311 E Dayton Ave
- 4430 N Teilman Ave
- 4685 N Wilson Ave
- 3640 N Van Ness Blvd
- 94 E Buckingham Way
- 118 E Buckingham Way
- 107 E Hampton Way
- 119 E Hampton Way
- 95 E Hampton Way
- 82 E Buckingham Way
- 130 E Buckingham Way
- 107 E Buckingham Way
- 131 E Hampton Way
- 83 E Hampton Way
- 91 E Buckingham Way
- 119 E Buckingham Way
- 142 E Buckingham Way
- 70 E Buckingham Way
- 143 E Hampton Way
- 71 E Hampton Way
- 79 E Buckingham Way
- 131 E Buckingham Way
- 110 E Hampton Way
- 104 E Ashlan Ave