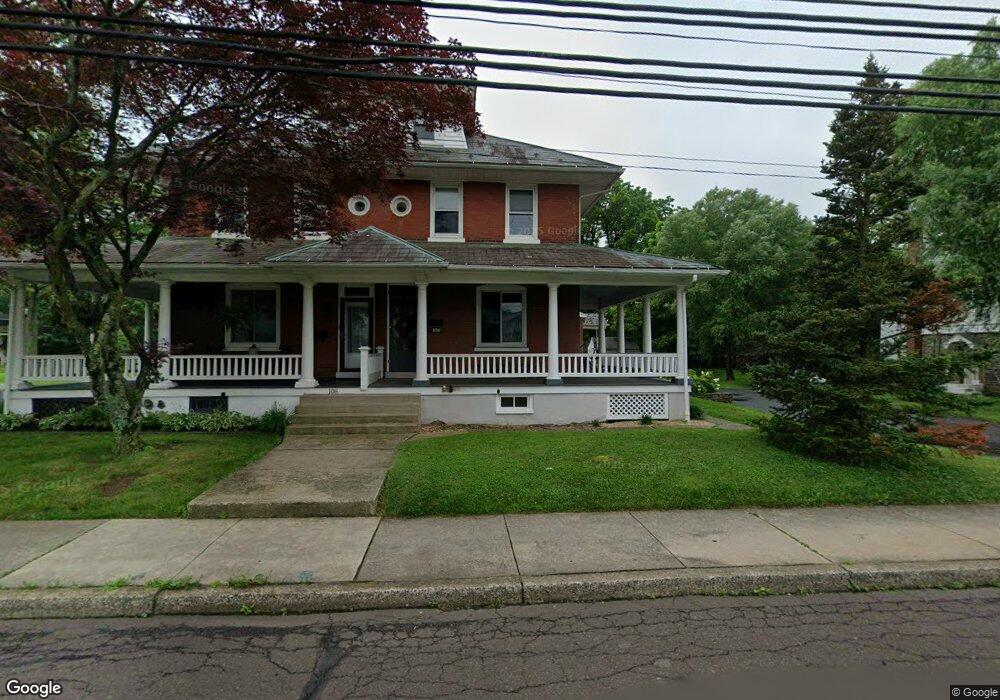
106 E Walnut St Perkasie, PA 18944
East Rockhill NeighborhoodEstimated Value: $413,766 - $492,000
4
Beds
2
Baths
2,441
Sq Ft
$181/Sq Ft
Est. Value
About This Home
This home is located at 106 E Walnut St, Perkasie, PA 18944 and is currently estimated at $442,442, approximately $181 per square foot. 106 E Walnut St is a home located in Bucks County with nearby schools including Pennridge High School and Community Service Foundation.
Ownership History
Date
Name
Owned For
Owner Type
Purchase Details
Closed on
Apr 13, 2018
Bought by
Galbraith Brian S
Current Estimated Value
Home Financials for this Owner
Home Financials are based on the most recent Mortgage that was taken out on this home.
Original Mortgage
$186,558
Outstanding Balance
$160,362
Interest Rate
4.42%
Estimated Equity
$282,080
Purchase Details
Closed on
Apr 30, 2013
Sold by
Coco Allyson A
Bought by
Zimmerman Matthew L and Zimmerman Elizabeth S
Home Financials for this Owner
Home Financials are based on the most recent Mortgage that was taken out on this home.
Original Mortgage
$178,400
Interest Rate
3.57%
Mortgage Type
New Conventional
Purchase Details
Closed on
Oct 28, 2004
Sold by
Nace Robert S and Nace Monica
Bought by
Coco Allyson A
Home Financials for this Owner
Home Financials are based on the most recent Mortgage that was taken out on this home.
Original Mortgage
$172,000
Interest Rate
5.75%
Mortgage Type
New Conventional
Create a Home Valuation Report for This Property
The Home Valuation Report is an in-depth analysis detailing your home's value as well as a comparison with similar homes in the area
Home Values in the Area
Average Home Value in this Area
Purchase History
| Date | Buyer | Sale Price | Title Company |
|---|---|---|---|
| Galbraith Brian S | $190,000 | -- | |
| Zimmerman Matthew L | $223,000 | None Available | |
| Coco Allyson A | $215,000 | -- |
Source: Public Records
Mortgage History
| Date | Status | Borrower | Loan Amount |
|---|---|---|---|
| Open | Galbraith Brian S | $186,558 | |
| Closed | Galbraith Brian S | -- | |
| Previous Owner | Zimmerman Matthew L | $178,400 | |
| Previous Owner | Coco Allyson A | $172,000 |
Source: Public Records
Tax History Compared to Growth
Tax History
| Year | Tax Paid | Tax Assessment Tax Assessment Total Assessment is a certain percentage of the fair market value that is determined by local assessors to be the total taxable value of land and additions on the property. | Land | Improvement |
|---|---|---|---|---|
| 2025 | $3,852 | $22,400 | $6,680 | $15,720 |
| 2024 | $3,852 | $22,400 | $6,680 | $15,720 |
| 2023 | $3,807 | $22,400 | $6,680 | $15,720 |
| 2022 | $3,807 | $22,400 | $6,680 | $15,720 |
| 2021 | $3,740 | $22,400 | $6,680 | $15,720 |
| 2020 | $3,740 | $22,400 | $6,680 | $15,720 |
| 2019 | $3,717 | $22,400 | $6,680 | $15,720 |
| 2018 | $3,717 | $22,400 | $6,680 | $15,720 |
| 2017 | $3,689 | $22,400 | $6,680 | $15,720 |
| 2016 | $3,689 | $22,400 | $6,680 | $15,720 |
| 2015 | -- | $22,400 | $6,680 | $15,720 |
| 2014 | -- | $22,400 | $6,680 | $15,720 |
Source: Public Records
Map
Nearby Homes
- 42 Independence Ct
- 121 Arbor Blvd
- 11B Fairview Ave
- 124 S Main St
- 504 S 4th St
- 604 W Walnut St
- 258 N 4th St
- 44 N 8th St Unit HOMESITE B22
- 40 N 8th St Unit HOMESITE B20
- 46 N 8th St Unit HOMESITE B23
- 48 N 8th St Unit HOMESITE B24
- 50 N 8th St Unit HOMESITE B25
- 52 N 8th St Unit HOMESITE B26
- 54 N 8th St Unit HOMESITE B27
- 912 Arch St
- 205 Parkridge Dr
- 508 Telegraph Rd
- 114 Orchard Rd
- 129 N Main St
- Newhaven Grand Plan at Green Ridge Estates West
- 104 E Walnut St
- 104 E Walnut St Unit C
- 2 Lot W Independence Ct
- 128 E Walnut St
- 1 Lot J Independence Ct
- 4 Lot J Independence Ct
- 1 Lot W Independence Ct
- 2 Lot W Independence Ct
- 204 E Walnut St
- 1 Lot H Independence Ct
- 100 E Walnut St
- 50 Independence Ct
- 1 Lot F Independence Ct
- 3 Lot F Independence Ct
- 2 Lot J Independence Ct
- 72 Independence Ct
- 38 Independence Ct
- 32 Independence Ct
- 16 Independence Ct
- 40 Independence Ct