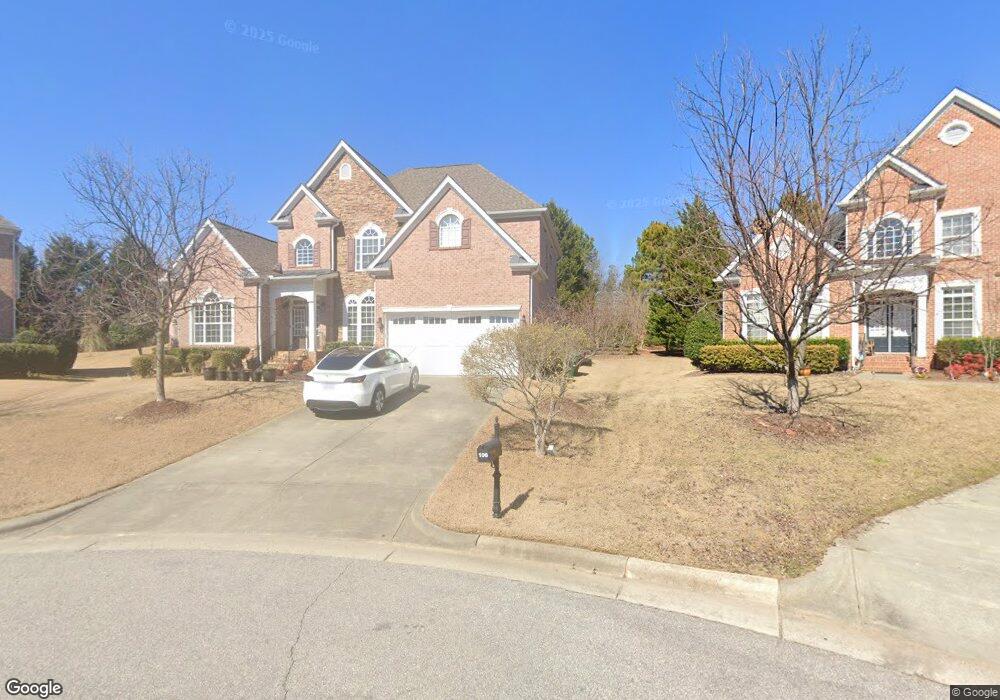
106 Espirit Ct Cary, NC 27519
West Cary NeighborhoodEstimated Value: $985,000 - $1,086,987
4
Beds
4
Baths
3,733
Sq Ft
$276/Sq Ft
Est. Value
About This Home
This home is located at 106 Espirit Ct, Cary, NC 27519 and is currently estimated at $1,030,247, approximately $275 per square foot. 106 Espirit Ct is a home located in Wake County with nearby schools including Green Hope Elementary, Davis Drive Middle, and Green Hope High.
Ownership History
Date
Name
Owned For
Owner Type
Purchase Details
Closed on
Nov 6, 2020
Sold by
Zhang Michael Hong Bo and Guan Yanan
Bought by
Zhang Michael Hong Bo and Guan Yanan
Current Estimated Value
Purchase Details
Closed on
Jun 17, 2013
Sold by
Kim Seok Tae and Kim Eun Kyung
Bought by
Bo Zhang Michael Hong and Guan Yanan
Home Financials for this Owner
Home Financials are based on the most recent Mortgage that was taken out on this home.
Original Mortgage
$385,000
Interest Rate
3.53%
Mortgage Type
New Conventional
Purchase Details
Closed on
Apr 20, 2006
Sold by
Mccar Homes Raleigh Llc
Bought by
Kim Seok Tae and Kyung Eun
Home Financials for this Owner
Home Financials are based on the most recent Mortgage that was taken out on this home.
Original Mortgage
$389,032
Interest Rate
4.87%
Mortgage Type
Purchase Money Mortgage
Create a Home Valuation Report for This Property
The Home Valuation Report is an in-depth analysis detailing your home's value as well as a comparison with similar homes in the area
Home Values in the Area
Average Home Value in this Area
Purchase History
| Date | Buyer | Sale Price | Title Company |
|---|---|---|---|
| Zhang Michael Hong Bo | -- | None Available | |
| Michael Hong Bo Zhang And Yanan Guan Living T | -- | None Listed On Document | |
| Bo Zhang Michael Hong | $525,000 | None Available | |
| Kim Seok Tae | $486,500 | None Available |
Source: Public Records
Mortgage History
| Date | Status | Borrower | Loan Amount |
|---|---|---|---|
| Previous Owner | Bo Zhang Michael Hong | $385,000 | |
| Previous Owner | Kim Seok Tae | $389,032 |
Source: Public Records
Tax History
| Year | Tax Paid | Tax Assessment Tax Assessment Total Assessment is a certain percentage of the fair market value that is determined by local assessors to be the total taxable value of land and additions on the property. | Land | Improvement |
|---|---|---|---|---|
| 2025 | $8,918 | $1,038,193 | $300,000 | $738,193 |
| 2024 | $8,725 | $1,038,193 | $300,000 | $738,193 |
Source: Public Records
Map
Nearby Homes
- 112 Natchez Ct
- 201 Beeston Ct
- 103 New Londondale Dr
- 3001 Valleystone Dr
- 2005 Valleystone Dr
- 107 Crestpoint Ct
- 112 Glen Abbey Dr
- 608 Marble House Ct
- 104 Parmalee Ct
- 202 Sarazen Meadow Way
- 101 Bartica Ct
- 104 Links End Dr
- 317 Indian Elm Ln
- 111 Gingergate Dr
- 114 Legault Dr
- 104 Fawley Ct
- 408 Hogans Valley Way
- 104 Cupola Chase Way
- 112 Hidden Rock Ct
- 408 Knotts Valley Ln
- 105 Espirit Ct
- 104 Espirit Ct
- 103 Espirit Ct
- 102 Espirit Ct
- 801 Willowmist Ct
- 106 Tamarak Wood Ct
- 803 Willowmist Ct
- 105 Tamarak Wood Ct
- 805 Willowmist Ct
- 101 Espirit Ct
- 602 Halcyon Meadow Dr
- 606 Halcyon Meadow Dr
- 201 Creststone Dr
- 612 Halcyon Meadow Dr
- 104 Tamarak Wood Ct
- 809 Willowmist Ct
- 609 Halcyon Meadow Dr
- 203 Creststone Dr
- 609 Halycon Meadow Dr
- 103 Tamarak Wood Ct
Your Personal Tour Guide
Ask me questions while you tour the home.