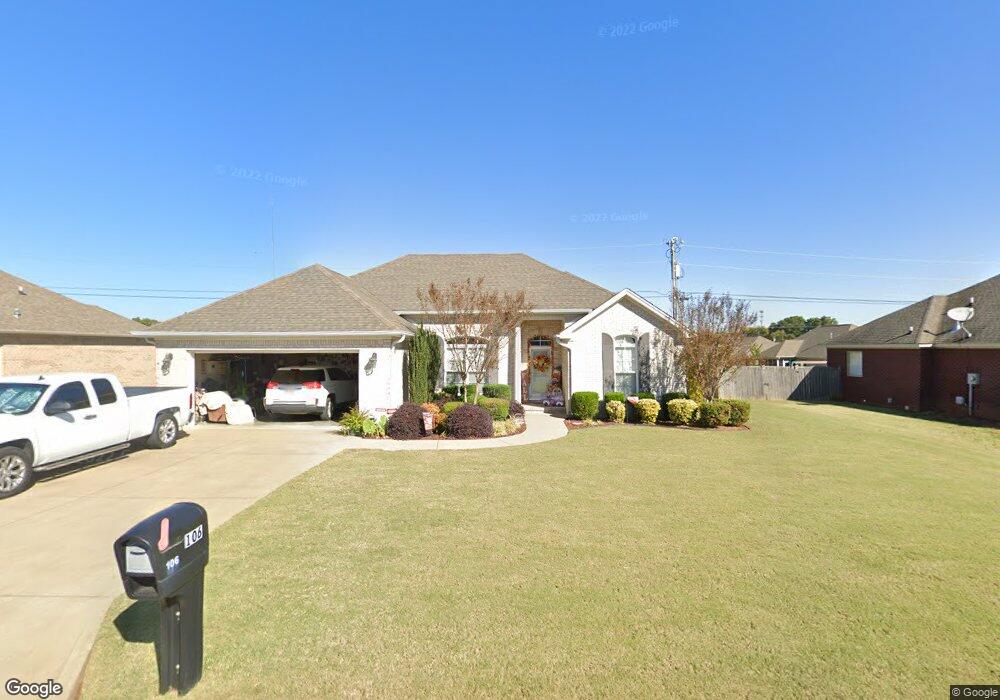
106 Fox Loop Muscle Shoals, AL 35661
Estimated Value: $261,327 - $280,000
3
Beds
2
Baths
1,475
Sq Ft
$184/Sq Ft
Est. Value
About This Home
This home is located at 106 Fox Loop, Muscle Shoals, AL 35661 and is currently estimated at $272,082, approximately $184 per square foot. 106 Fox Loop is a home located in Colbert County with nearby schools including Highland Park Elementary School, McBride Elementary School, and Muscle Shoals Middle School.
Ownership History
Date
Name
Owned For
Owner Type
Purchase Details
Closed on
Mar 12, 2025
Sold by
Thompson Elizabeth C and Thompson James L
Bought by
Thompson Elizabeth C and Thompson Kimberly D
Current Estimated Value
Purchase Details
Closed on
Oct 9, 2008
Sold by
Obryant Development Llc
Bought by
Thompson James L and Thompson Elizabeth C
Home Financials for this Owner
Home Financials are based on the most recent Mortgage that was taken out on this home.
Original Mortgage
$122,550
Interest Rate
5.96%
Mortgage Type
Purchase Money Mortgage
Create a Home Valuation Report for This Property
The Home Valuation Report is an in-depth analysis detailing your home's value as well as a comparison with similar homes in the area
Home Values in the Area
Average Home Value in this Area
Purchase History
| Date | Buyer | Sale Price | Title Company |
|---|---|---|---|
| Thompson Elizabeth C | $233,000 | Attorney Only | |
| Thompson James L | $129,000 | -- |
Source: Public Records
Mortgage History
| Date | Status | Borrower | Loan Amount |
|---|---|---|---|
| Previous Owner | Thompson James L | $122,550 |
Source: Public Records
Tax History Compared to Growth
Tax History
| Year | Tax Paid | Tax Assessment Tax Assessment Total Assessment is a certain percentage of the fair market value that is determined by local assessors to be the total taxable value of land and additions on the property. | Land | Improvement |
|---|---|---|---|---|
| 2024 | $775 | $23,280 | $3,500 | $19,780 |
| 2023 | $775 | $21,540 | $0 | $0 |
| 2022 | $613 | $18,520 | $0 | $0 |
| 2021 | $611 | $18,480 | $0 | $0 |
| 2020 | $577 | $17,480 | $0 | $0 |
| 2019 | $556 | $16,840 | $0 | $0 |
| 2018 | $556 | $16,840 | $0 | $0 |
| 2017 | $524 | $15,920 | $0 | $0 |
| 2016 | $585 | $15,500 | $0 | $0 |
| 2013 | -- | $0 | $0 | $0 |
Source: Public Records
Map
Nearby Homes