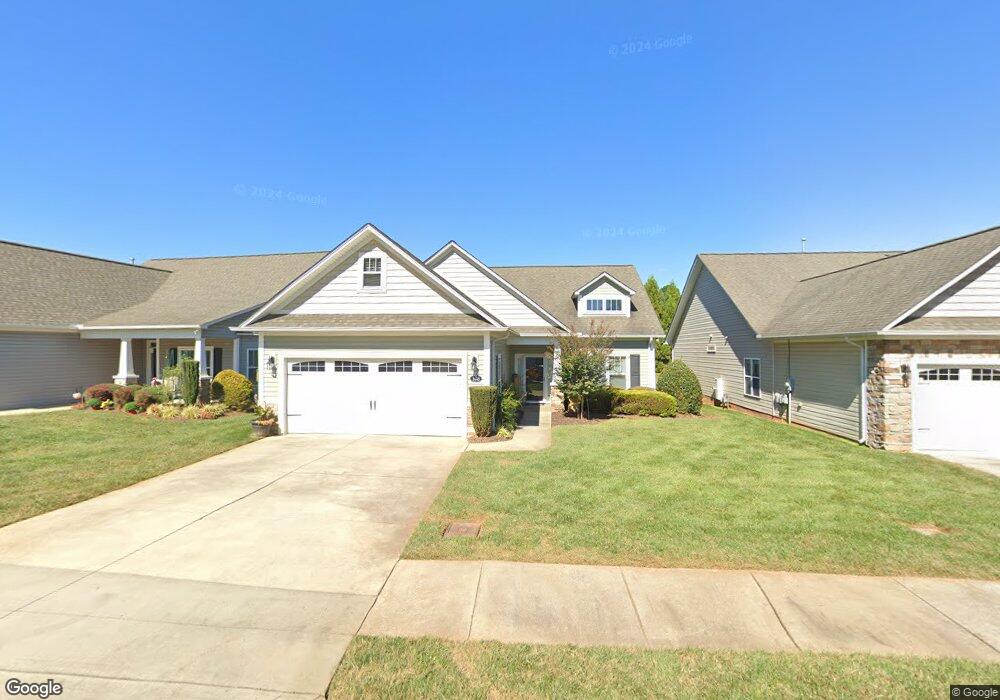
106 Garner Dr Unit 2 Salisbury, NC 28146
Estimated Value: $322,147 - $394,000
2
Beds
2
Baths
1,632
Sq Ft
$218/Sq Ft
Est. Value
About This Home
This home is located at 106 Garner Dr Unit 2, Salisbury, NC 28146 and is currently estimated at $355,787, approximately $218 per square foot. 106 Garner Dr Unit 2 is a home located in Rowan County with nearby schools including Granite Quarry Elementary School, Charles C Erwin Middle School, and East Rowan High School.
Ownership History
Date
Name
Owned For
Owner Type
Purchase Details
Closed on
Dec 8, 2025
Sold by
Cornelison Paula Gillis
Bought by
Cornelison Paula Gillis and Forbis Ashley Dwayne
Current Estimated Value
Purchase Details
Closed on
Aug 6, 2018
Sold by
Blackwelder Jeremy Michael and Blackwelder Becca B
Bought by
Cornelison Paula D
Purchase Details
Closed on
Apr 28, 2016
Sold by
Spencer Lane Construction Llc
Bought by
Blackwelder Jeremy Michael
Purchase Details
Closed on
Feb 11, 2016
Sold by
Pryor Magdalena and Pryor Jerry
Bought by
Spencer Lane Construction Llc
Purchase Details
Closed on
Oct 15, 2015
Sold by
Boganski Henry M
Bought by
Pryor Magdalena
Purchase Details
Closed on
Aug 27, 2009
Sold by
Spencer Lane Construction Llc
Bought by
Boganski Henry M and Boganski Christina E
Purchase Details
Closed on
Oct 28, 2008
Sold by
Burgess & Associates Inc
Bought by
Spencer Lane Construction Llc
Create a Home Valuation Report for This Property
The Home Valuation Report is an in-depth analysis detailing your home's value as well as a comparison with similar homes in the area
Purchase History
We collect this data history from publicly available records. To have your information removed, we recommend requesting removal directly through your county’s website.
| Date | Buyer | Sale Price | Title Company |
|---|---|---|---|
| Cornelison Paula Gillis | -- | None Listed On Document | |
| Cornelison Paula D | $205,000 | None Available | |
| Blackwelder Jeremy Michael | $182,500 | None Available | |
| Spencer Lane Construction Llc | $145,000 | None Available | |
| Pryor Magdalena | $166,000 | None Available | |
| Boganski Henry M | $194,000 | None Available | |
| Spencer Lane Construction Llc | $120,000 | None Available |
Source: Public Records
Tax History
| Year | Tax Paid | Tax Assessment Tax Assessment Total Assessment is a certain percentage of the fair market value that is determined by local assessors to be the total taxable value of land and additions on the property. | Land | Improvement |
|---|---|---|---|---|
| 2025 | $3,325 | $278,049 | $34,000 | $244,049 |
| 2024 | $3,325 | $278,049 | $34,000 | $244,049 |
| 2023 | $3,325 | $278,049 | $34,000 | $244,049 |
| 2022 | $2,733 | $198,486 | $34,000 | $164,486 |
| 2021 | $2,733 | $198,486 | $34,000 | $164,486 |
| 2020 | $2,733 | $198,486 | $34,000 | $164,486 |
| 2019 | $2,733 | $198,486 | $34,000 | $164,486 |
| 2018 | $2,332 | $171,660 | $34,000 | $137,660 |
| 2017 | $2,320 | $171,660 | $34,000 | $137,660 |
| 2016 | $2,256 | $171,660 | $34,000 | $137,660 |
| 2015 | $2,270 | $171,660 | $34,000 | $137,660 |
| 2014 | $2,283 | $174,719 | $34,000 | $140,719 |
Source: Public Records
Map
Nearby Homes
- 115 River Birch Dr
- 2105 Faith Rd
- 237 River Birch Dr
- 415 Garner Dr
- 412 Garner Dr
- 604 Cordova Ct
- 453 Pepperstone Dr
- 327 River Birch Dr
- 407 Oak Forest Ln
- 1425 Faith Rd
- 429 Oak Brook Dr
- 609 Oak Forest Ln
- 507 Oak Brook Dr
- 818 Pine Hill Dr
- 427 Park Gq Ave
- 120 Ridgewood Ct
- 1207 Oak Haven Dr
- 321 Stone Ridge Dr
- 1203 Edgewater Ct
- 106 Mist Valley Dr
- 106 Garner Dr
- 102 Garner Dr
- 110 Garner Dr
- 114 Garner Dr
- 111 River Birch Dr
- 118 Garner Dr
- 105 Garner Dr
- 109 Garner Dr
- 101 Garner Dr
- 113 Garner Dr
- 107 River Birch Dr
- 201 River Birch Dr
- 205 River Birch Dr
- 2045 Faith Rd
- 103 River Birch Dr
- 110 River Birch Dr
- 114 River Birch Dr
- 118 River Birch Dr
- 2065 Faith Rd
- 2085 Faith Rd
Your Personal Tour Guide
Ask me questions while you tour the home.