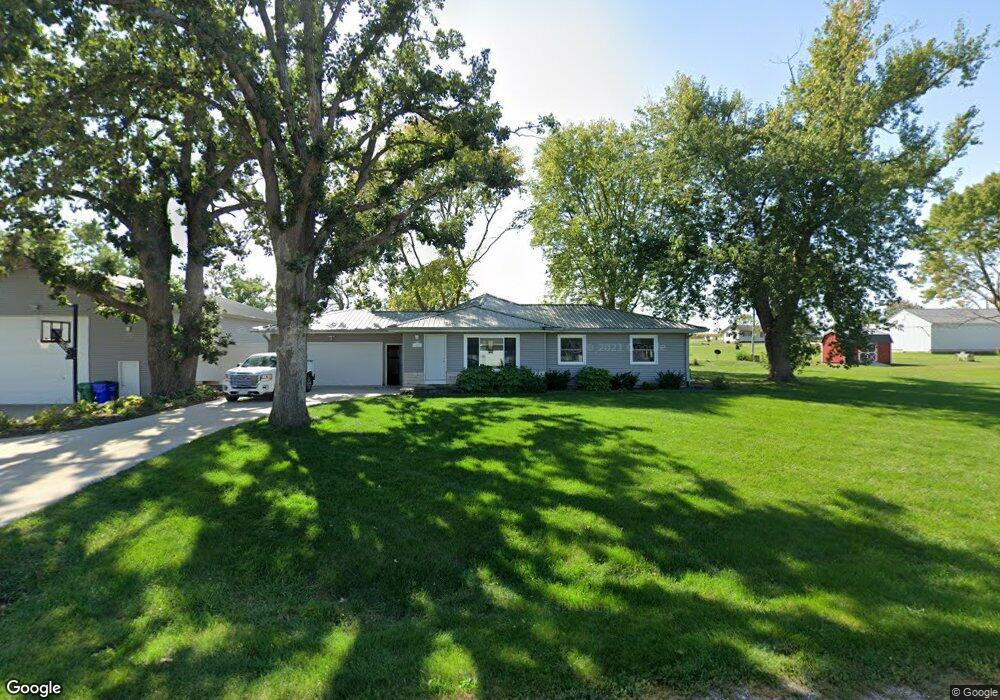
106 Harbert St SW Shellsburg, IA 52332
Estimated Value: $300,000 - $363,000
3
Beds
2
Baths
1,098
Sq Ft
$303/Sq Ft
Est. Value
About This Home
This home is located at 106 Harbert St SW, Shellsburg, IA 52332 and is currently estimated at $333,139, approximately $303 per square foot. 106 Harbert St SW is a home located in Benton County with nearby schools including Shellsburg Elementary School, Vinton-Shellsburg Middle School, and Vinton-Shellsburg High School.
Ownership History
Date
Name
Owned For
Owner Type
Purchase Details
Closed on
Jun 1, 2013
Sold by
Stinson Robert E
Bought by
Chapman Scott A and Chapman Lindsey
Current Estimated Value
Home Financials for this Owner
Home Financials are based on the most recent Mortgage that was taken out on this home.
Original Mortgage
$90,000
Outstanding Balance
$19,500
Interest Rate
3.38%
Mortgage Type
New Conventional
Estimated Equity
$313,639
Purchase Details
Closed on
Feb 16, 2010
Sold by
Mcclintock Wayne and Mcclintock Regina
Bought by
Stinson Robert E
Home Financials for this Owner
Home Financials are based on the most recent Mortgage that was taken out on this home.
Original Mortgage
$111,416
Interest Rate
5.11%
Mortgage Type
FHA
Purchase Details
Closed on
Oct 20, 2009
Sold by
Mcclintock Norman D
Bought by
Mcclintock Wayne and Satariano Jo Dee
Create a Home Valuation Report for This Property
The Home Valuation Report is an in-depth analysis detailing your home's value as well as a comparison with similar homes in the area
Purchase History
| Date | Buyer | Sale Price | Title Company |
|---|---|---|---|
| Chapman Scott A | $115,000 | None Available | |
| Stinson Robert E | $121,500 | None Available | |
| Mcclintock Wayne | -- | None Available |
Source: Public Records
Mortgage History
| Date | Status | Borrower | Loan Amount |
|---|---|---|---|
| Open | Chapman Scott A | $90,000 | |
| Previous Owner | Stinson Robert E | $111,416 |
Source: Public Records
Tax History
| Year | Tax Paid | Tax Assessment Tax Assessment Total Assessment is a certain percentage of the fair market value that is determined by local assessors to be the total taxable value of land and additions on the property. | Land | Improvement |
|---|---|---|---|---|
| 2025 | $5,078 | $330,700 | $40,600 | $290,100 |
| 2024 | $5,078 | $300,000 | $40,900 | $259,100 |
| 2023 | $4,788 | $300,000 | $40,900 | $259,100 |
| 2022 | $4,728 | $249,700 | $32,700 | $217,000 |
| 2021 | $4,728 | $249,700 | $32,700 | $217,000 |
| 2020 | $4,046 | $212,500 | $26,300 | $186,200 |
| 2019 | $3,928 | $212,500 | $26,300 | $186,200 |
| 2018 | $3,780 | $206,600 | $23,100 | $183,500 |
| 2017 | $3,430 | $206,600 | $23,100 | $183,500 |
| 2016 | $3,358 | $179,300 | $22,200 | $157,100 |
| 2015 | $3,358 | $179,300 | $22,200 | $157,100 |
| 2014 | $2,200 | $111,500 | $0 | $0 |
Source: Public Records
Map
Nearby Homes
- 301 Wildcat Ct
- 201 Grove St NW
- 401 Main St NW
- 700 Sunset Blvd
- 804 Fairway Dr
- 105 Meadow Dr
- 103 Meadow Dr
- 101 Meadow Dr
- 208 Northgate St NW
- 6240 33rd Avenue Dr
- 0 31st Ave
- 2573 Linn Benton Rd
- 0 Benton Linn Rd
- 926 Indigo Dr
- 736 Indigo Dr
- 827 Indigo Dr
- Lots 223 & 224 Juneberry Dr
- Lots 225 & 226 Juneberry Dr
- Lots 217 & 218 Juneberry Dr
- 225 Sumac Dr
- 112 Harbert St SW
- 104 Harbert St SW
- 107 Harbert St SW
- 109 Harbert St SW
- 103 College St SW
- 308 Smith St SW
- 115 Harbert St SW
- 106 Johnson St SW
- 104 Johnson St SW
- 102 Johnson St SW
- 108 College St SW
- 401 Grand Ave SW
- 100 Johnson St SW
- 112 Johnson St SW
- 110 College St SW
- 409 Grand Ave SW
- 307 Grand Ave SW
- 309 Grand Ave SW
- 305 Grand Ave SW
- 113 Autumn St SW
Your Personal Tour Guide
Ask me questions while you tour the home.