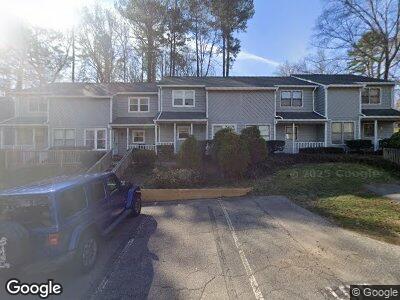
106 Inverness Ct Cary, NC 27511
South Cary NeighborhoodEstimated Value: $277,000 - $300,645
2
Beds
3
Baths
1,198
Sq Ft
$242/Sq Ft
Est. Value
About This Home
This home is located at 106 Inverness Ct, Cary, NC 27511 and is currently estimated at $290,411, approximately $242 per square foot. 106 Inverness Ct is a home located in Wake County with nearby schools including Laurel Park Elementary, Salem Middle, and Apex High School.
Ownership History
Date
Name
Owned For
Owner Type
Purchase Details
Closed on
Sep 18, 2019
Sold by
Pleasants Timothy D
Bought by
Morrissey Angela K
Current Estimated Value
Home Financials for this Owner
Home Financials are based on the most recent Mortgage that was taken out on this home.
Original Mortgage
$110,000
Outstanding Balance
$97,605
Interest Rate
3.6%
Mortgage Type
New Conventional
Estimated Equity
$192,806
Purchase Details
Closed on
May 7, 2012
Sold by
Delallo Kimberly Marie
Bought by
Naffky Jeri L
Home Financials for this Owner
Home Financials are based on the most recent Mortgage that was taken out on this home.
Original Mortgage
$100,605
Interest Rate
4.13%
Mortgage Type
New Conventional
Purchase Details
Closed on
Oct 5, 2004
Sold by
Thigpen Larry T
Bought by
Pleasants Timothy D
Home Financials for this Owner
Home Financials are based on the most recent Mortgage that was taken out on this home.
Original Mortgage
$98,900
Interest Rate
4.87%
Mortgage Type
Unknown
Purchase Details
Closed on
Mar 30, 2001
Sold by
Westnedge Olivia C
Bought by
Thigpen Larry T
Home Financials for this Owner
Home Financials are based on the most recent Mortgage that was taken out on this home.
Original Mortgage
$91,603
Interest Rate
7.02%
Mortgage Type
VA
Create a Home Valuation Report for This Property
The Home Valuation Report is an in-depth analysis detailing your home's value as well as a comparison with similar homes in the area
Home Values in the Area
Average Home Value in this Area
Purchase History
| Date | Buyer | Sale Price | Title Company |
|---|---|---|---|
| Morrissey Angela K | $170,000 | None Available | |
| Naffky Jeri L | $107,000 | None Available | |
| Pleasants Timothy D | $99,000 | -- | |
| Thigpen Larry T | $95,000 | -- |
Source: Public Records
Mortgage History
| Date | Status | Borrower | Loan Amount |
|---|---|---|---|
| Open | Morrissey Angela K | $110,000 | |
| Previous Owner | Naffky Jeri L | $100,605 | |
| Previous Owner | Pleasants Timothy D | $98,900 | |
| Previous Owner | Thigpen Larry | $84,000 | |
| Previous Owner | Thigpen Larry | $20,000 | |
| Previous Owner | Thigpen Larry T | $91,603 |
Source: Public Records
Tax History Compared to Growth
Tax History
| Year | Tax Paid | Tax Assessment Tax Assessment Total Assessment is a certain percentage of the fair market value that is determined by local assessors to be the total taxable value of land and additions on the property. | Land | Improvement |
|---|---|---|---|---|
| 2024 | $2,421 | $286,328 | $115,000 | $171,328 |
| 2023 | $1,704 | $168,050 | $50,000 | $118,050 |
| 2022 | $1,641 | $168,050 | $50,000 | $118,050 |
| 2021 | $1,608 | $168,050 | $50,000 | $118,050 |
| 2020 | $1,616 | $168,050 | $50,000 | $118,050 |
| 2019 | $1,285 | $118,173 | $32,000 | $86,173 |
| 2018 | $1,207 | $118,173 | $32,000 | $86,173 |
| 2017 | $1,160 | $118,173 | $32,000 | $86,173 |
| 2016 | $1,143 | $118,173 | $32,000 | $86,173 |
| 2015 | $1,088 | $108,461 | $26,000 | $82,461 |
| 2014 | -- | $108,461 | $26,000 | $82,461 |
Source: Public Records
Map
Nearby Homes
- 1800 Tarbert Dr
- 1312 Rothes Rd
- 1517 Laughridge Dr
- 206 Kettlebridge Dr
- 1225 Kilmory Dr
- 1503 Laughridge Dr
- 1308 Helmsdale Dr
- 1541 Old Apex Rd
- 204 Brittany Place
- 315 King George Loop
- 1416 Dunbar Ct
- 359 Ashton Ridge Ln
- 2109 W Marilyn Cir
- 404 Versailles Dr
- 3047 Kilarney Ridge Loop
- 203 Lighthouse Way
- 117 Buena Vista Dr
- 103 Donna Place
- 256 Marilyn Cir
- 227 Chimney Rise Dr
- 106 Inverness Ct
- 104 Inverness Ct
- 108 Inverness Ct
- 102 Inverness Ct
- 110 Inverness Ct
- 112 Inverness Ct
- 212 Applecross Dr
- 210 Applecross Dr
- 114 Inverness Ct
- 208 Applecross Dr
- 101 Inverness Ct
- 103 Inverness Ct
- 206 Applecross Dr
- 105 Inverness Ct
- 118 Inverness Ct
- 304 Applecross Dr
- 124 Assembly Ct
- 204 Applecross Dr
- 120 Inverness Ct
- 306 Applecross Dr