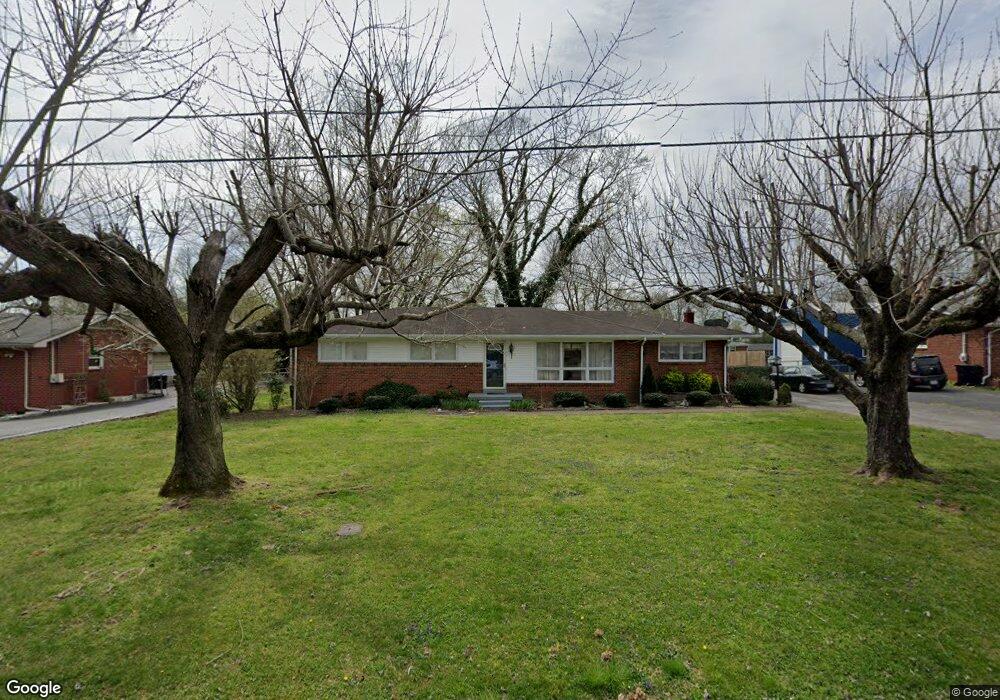
106 Maple Dr Smyrna, TN 37167
Estimated Value: $249,917 - $361,000
Studio
2
Baths
1,394
Sq Ft
$220/Sq Ft
Est. Value
About This Home
This home is located at 106 Maple Dr, Smyrna, TN 37167 and is currently estimated at $306,979, approximately $220 per square foot. 106 Maple Dr is a home located in Rutherford County with nearby schools including Smyrna Elementary School, Smyrna Middle School, and Smyrna High School.
Ownership History
Date
Name
Owned For
Owner Type
Purchase Details
Closed on
Sep 21, 2020
Sold by
Turner Joe R
Bought by
Turner Joe R and Turner Carol A
Current Estimated Value
Home Financials for this Owner
Home Financials are based on the most recent Mortgage that was taken out on this home.
Original Mortgage
$180,048
Outstanding Balance
$159,781
Interest Rate
2.9%
Mortgage Type
VA
Estimated Equity
$147,198
Purchase Details
Closed on
Oct 15, 2012
Sold by
Turner Joe R
Bought by
Turner Joe R
Purchase Details
Closed on
Apr 27, 2007
Sold by
Dlp Ministry Inc
Bought by
Turner Joe R and Turner Carol A
Home Financials for this Owner
Home Financials are based on the most recent Mortgage that was taken out on this home.
Original Mortgage
$153,000
Interest Rate
6.11%
Purchase Details
Closed on
Nov 16, 2006
Sold by
Ford John H
Bought by
Dlp Ministry Inc
Create a Home Valuation Report for This Property
The Home Valuation Report is an in-depth analysis detailing your home's value as well as a comparison with similar homes in the area
Home Values in the Area
Average Home Value in this Area
Purchase History
| Date | Buyer | Sale Price | Title Company |
|---|---|---|---|
| Turner Joe R | -- | Limestone Title & Escrow Llc | |
| Turner Joe R | -- | -- | |
| Turner Joe R | $153,000 | -- | |
| Dlp Ministry Inc | $105,050 | -- |
Source: Public Records
Mortgage History
| Date | Status | Borrower | Loan Amount |
|---|---|---|---|
| Open | Turner Joe R | $180,048 | |
| Closed | Dlp Ministry Inc | $145,662 | |
| Previous Owner | Dlp Ministry Inc | $153,000 |
Source: Public Records
Tax History
| Year | Tax Paid | Tax Assessment Tax Assessment Total Assessment is a certain percentage of the fair market value that is determined by local assessors to be the total taxable value of land and additions on the property. | Land | Improvement |
|---|---|---|---|---|
| 2025 | $1,418 | $59,050 | $13,750 | $45,300 |
| 2024 | $1,418 | $59,050 | $13,750 | $45,300 |
| 2023 | $1,418 | $59,050 | $13,750 | $45,300 |
| 2022 | $1,264 | $59,050 | $13,750 | $45,300 |
| 2021 | $1,217 | $41,675 | $8,750 | $32,925 |
| 2020 | $1,217 | $41,675 | $8,750 | $32,925 |
| 2019 | $1,217 | $41,675 | $8,750 | $32,925 |
| 2018 | $1,167 | $41,675 | $0 | $0 |
| 2017 | $1,013 | $28,425 | $0 | $0 |
| 2016 | $1,013 | $28,425 | $0 | $0 |
| 2015 | $1,013 | $28,425 | $0 | $0 |
| 2014 | $707 | $28,425 | $0 | $0 |
| 2013 | -- | $22,400 | $0 | $0 |
Source: Public Records
Map
Nearby Homes
- 0 Enon Springs Rd W
- 102 Old Jones Mill Rd
- 402 Holston Dr
- 217 Pebble Place
- 101 Oak St
- 380 Sam Davis Rd
- 135 Cross Ct
- 205 Martha St
- 160 Twain Aly
- 401 Ravencliff Ct
- 515 Mary St
- 103 College St
- 108 Fairview Ave
- 310 Gracy Ave
- 104 Crescent Ave
- 108 Kings Rd
- 106 Kings Rd
- 113 Lake Farm Rd
- 508 Enon Springs Rd W
- 124 Chevy Chase Trail
- 108 Maple Dr
- 104 Maple Dr
- 1005 Peachtree Dr
- 1007 Peachtree Dr
- 1003 Peachtree Dr
- 105 Maple Dr
- 110 Maple Dr
- 102 Maple Dr
- 107 Maple Dr
- 103 Maple Dr
- 1009 Peachtree Dr
- 1001 Peachtree Dr
- 109 Maple Dr
- 101 Maple Dr
- 108 Sycamore Dr Unit 112
- 300 Lynn St
- 1006 Peachtree Dr
- 104 Sycamore Dr Unit AB
- 114 Sycamore Dr Unit 116
- 1010 Peachtree Dr
Your Personal Tour Guide
Ask me questions while you tour the home.