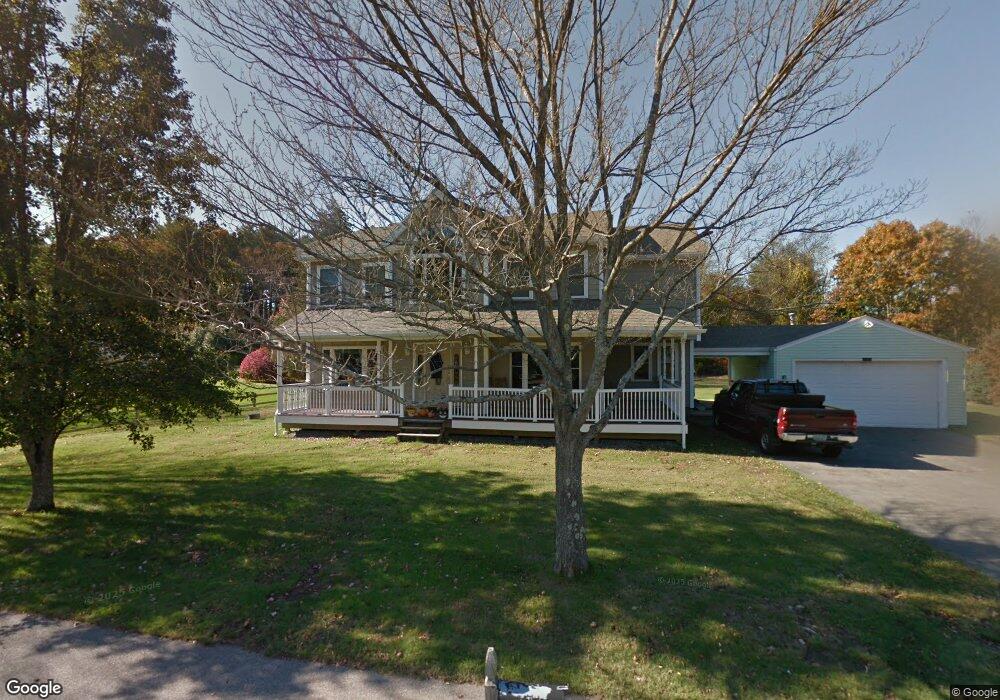
106 Maple St Wenham, MA 01984
Estimated Value: $1,035,000 - $1,186,000
3
Beds
1
Bath
1,400
Sq Ft
$782/Sq Ft
Est. Value
About This Home
This home is located at 106 Maple St, Wenham, MA 01984 and is currently estimated at $1,094,753, approximately $781 per square foot. 106 Maple St is a home located in Essex County with nearby schools including Winthrop School, Cutler Elementary School, and Miles River Middle School.
Ownership History
Date
Name
Owned For
Owner Type
Purchase Details
Closed on
Jul 27, 2005
Sold by
106 Maple Street Nt and Macfarlane Bruce A
Bought by
Michaud Ronald J L and Pitman Wendy L
Current Estimated Value
Purchase Details
Closed on
Aug 19, 1996
Sold by
Macfarlane Virginia and Macfarlane James
Bought by
Macfarlane Bruce A
Create a Home Valuation Report for This Property
The Home Valuation Report is an in-depth analysis detailing your home's value as well as a comparison with similar homes in the area
Home Values in the Area
Average Home Value in this Area
Purchase History
| Date | Buyer | Sale Price | Title Company |
|---|---|---|---|
| Michaud Ronald J L | $365,000 | -- | |
| Macfarlane Bruce A | $175,000 | -- |
Source: Public Records
Mortgage History
| Date | Status | Borrower | Loan Amount |
|---|---|---|---|
| Open | Macfarlane Bruce A | $408,000 | |
| Closed | Macfarlane Bruce A | $417,000 | |
| Closed | Macfarlane Bruce A | $150,000 |
Source: Public Records
Tax History Compared to Growth
Tax History
| Year | Tax Paid | Tax Assessment Tax Assessment Total Assessment is a certain percentage of the fair market value that is determined by local assessors to be the total taxable value of land and additions on the property. | Land | Improvement |
|---|---|---|---|---|
| 2025 | $13,506 | $869,100 | $383,900 | $485,200 |
| 2024 | $13,187 | $842,100 | $383,900 | $458,200 |
| 2023 | $12,513 | $721,200 | $400,700 | $320,500 |
| 2022 | $11,417 | $583,100 | $264,900 | $318,200 |
| 2021 | $11,040 | $561,000 | $242,800 | $318,200 |
| 2020 | $9,932 | $524,400 | $240,000 | $284,400 |
| 2019 | $9,450 | $524,400 | $240,000 | $284,400 |
| 2018 | $9,359 | $498,100 | $246,000 | $252,100 |
| 2017 | $8,930 | $487,200 | $246,000 | $241,200 |
| 2016 | $8,273 | $487,200 | $246,000 | $241,200 |
| 2015 | $7,917 | $487,200 | $246,000 | $241,200 |
Source: Public Records
Map
Nearby Homes