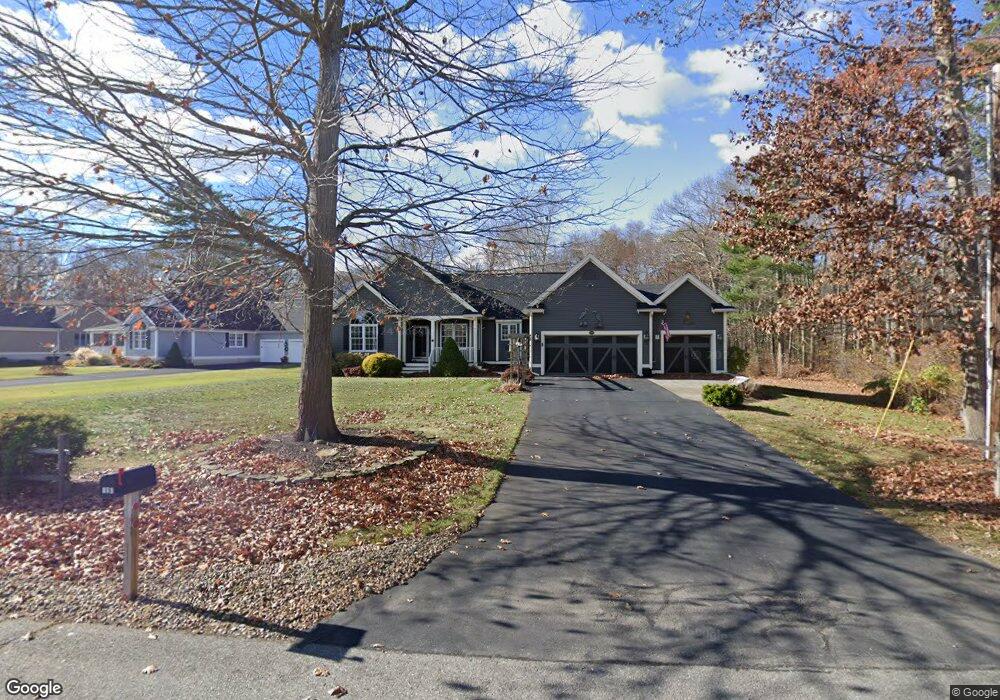
106 Marshview Cir Seabrook, NH 03874
Estimated Value: $656,000 - $771,000
3
Beds
2
Baths
1,749
Sq Ft
$411/Sq Ft
Est. Value
About This Home
This home is located at 106 Marshview Cir, Seabrook, NH 03874 and is currently estimated at $718,078, approximately $410 per square foot. 106 Marshview Cir is a home located in Rockingham County with nearby schools including Seabrook Elementary School, Seabrook Middle School, and Winnacunnet High School.
Ownership History
Date
Name
Owned For
Owner Type
Purchase Details
Closed on
Aug 3, 2023
Sold by
Southwick William C and Southwick Frances J
Bought by
Southwick Adam W
Current Estimated Value
Purchase Details
Closed on
Jun 15, 2004
Sold by
Peterson Jerry L and Peterson Debra M
Bought by
Southwick William C and Southwick Frances J
Purchase Details
Closed on
May 27, 1999
Sold by
Seabrook Shores Ests I
Bought by
Walker Melissa G
Home Financials for this Owner
Home Financials are based on the most recent Mortgage that was taken out on this home.
Original Mortgage
$37,000
Interest Rate
6.82%
Mortgage Type
Purchase Money Mortgage
Create a Home Valuation Report for This Property
The Home Valuation Report is an in-depth analysis detailing your home's value as well as a comparison with similar homes in the area
Home Values in the Area
Average Home Value in this Area
Purchase History
| Date | Buyer | Sale Price | Title Company |
|---|---|---|---|
| Southwick Adam W | -- | None Available | |
| Southwick William C | $395,000 | -- | |
| Southwick William C | $395,000 | -- | |
| Walker Melissa G | $70,000 | -- | |
| Walker Melissa G | $70,000 | -- |
Source: Public Records
Mortgage History
| Date | Status | Borrower | Loan Amount |
|---|---|---|---|
| Previous Owner | Walker Melissa G | $75,000 | |
| Previous Owner | Walker Melissa G | $37,000 |
Source: Public Records
Tax History Compared to Growth
Tax History
| Year | Tax Paid | Tax Assessment Tax Assessment Total Assessment is a certain percentage of the fair market value that is determined by local assessors to be the total taxable value of land and additions on the property. | Land | Improvement |
|---|---|---|---|---|
| 2024 | $7,919 | $675,700 | $291,300 | $384,400 |
| 2023 | $8,330 | $552,000 | $231,700 | $320,300 |
| 2022 | $7,314 | $552,000 | $231,700 | $320,300 |
| 2021 | $7,579 | $552,000 | $231,700 | $320,300 |
| 2020 | $6,682 | $418,400 | $175,800 | $242,600 |
| 2019 | $6,590 | $418,400 | $175,800 | $242,600 |
| 2018 | $6,799 | $418,400 | $175,800 | $242,600 |
| 2017 | $6,799 | $418,400 | $175,800 | $242,600 |
| 2016 | $6,332 | $428,100 | $185,500 | $242,600 |
| 2015 | $5,290 | $357,700 | $137,500 | $220,200 |
| 2014 | $5,425 | $355,300 | $137,500 | $217,800 |
| 2013 | $5,354 | $350,600 | $137,500 | $213,100 |
Source: Public Records
Map
Nearby Homes
- 22 Robert Rd
- 207 S Main St
- 124 Whip-Poor-will St
- 84 S Main St
- 19 Fowlers Ct
- 312 S Main St
- 308 Route 286 Unit 77
- 308 Route 286 Unit Lot 58
- 308 Route 286 Unit Lot 34
- 2 Collins St
- 308 State Route 286 Unit Lot 108
- 308 State Route 286 Unit Lot 73
- 308 State Route 286 Unit Lot 87
- 10 Caitlin Cir Unit B
- 22 Farm Ln
- 44 Seabrook Rd
- 27 Cross Beach Rd
- 241 & 245 Lafayette Rd
- 100 Forest Rd
- 595 N End Blvd Unit 2
- 110 Marshview Cir
- 102 Marshview Cir
- 2 Saltmarsh Ave
- 114 Marshview Cir
- 1 Old Salt Dr
- 1 Saltmarsh Ave
- 100 Marshview Cir
- 5 Old Salt Dr
- 6 Salmarsh
- 6 Saltmarsh Ave
- 118 Marshview Cir
- 9 Old Salt Dr
- 94 Marshview Cir
- 45 Marshview Cir
- 2 Old Salt Dr
- 6 Old Salt Dr
- 10 Saltmarsh Ave
- 122 Marshview Cir
- 10 Old Salt Dr
- 41 Marshview Cir