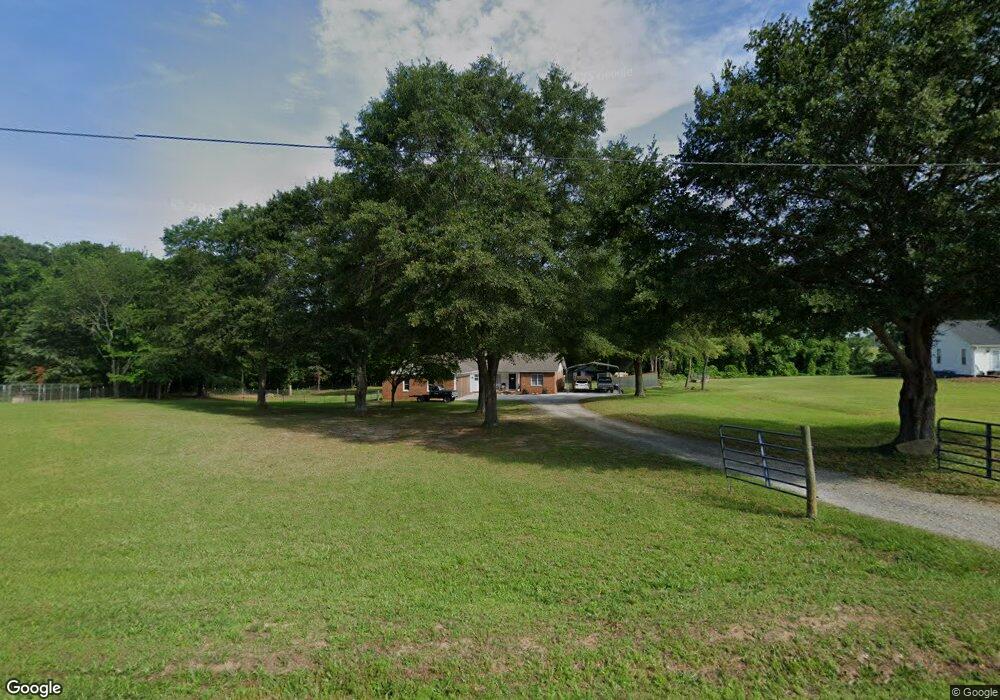
106 Mountainview Ct Pelzer, SC 29669
Estimated Value: $187,629 - $409,000
Studio
--
Bath
1,861
Sq Ft
$144/Sq Ft
Est. Value
About This Home
This home is located at 106 Mountainview Ct, Pelzer, SC 29669 and is currently estimated at $267,907, approximately $143 per square foot. 106 Mountainview Ct is a home with nearby schools including Spearman Elementary School, Wren Middle School, and Wren High School.
Ownership History
Date
Name
Owned For
Owner Type
Purchase Details
Closed on
Nov 6, 2020
Sold by
Eldridge Matthew Dennis
Bought by
Rogers Adrian John and Rogers Parris
Current Estimated Value
Home Financials for this Owner
Home Financials are based on the most recent Mortgage that was taken out on this home.
Original Mortgage
$93,279
Outstanding Balance
$81,861
Interest Rate
2.8%
Mortgage Type
FHA
Estimated Equity
$186,046
Purchase Details
Closed on
Sep 10, 2020
Sold by
Eldridge Julie and Estate Of Devin Wade Eldridge
Bought by
Eldgridge Matthew Dennis
Home Financials for this Owner
Home Financials are based on the most recent Mortgage that was taken out on this home.
Original Mortgage
$93,279
Outstanding Balance
$81,861
Interest Rate
2.8%
Mortgage Type
FHA
Estimated Equity
$186,046
Purchase Details
Closed on
Sep 6, 2019
Sold by
Moore Earle M
Bought by
Eldridge Devin
Home Financials for this Owner
Home Financials are based on the most recent Mortgage that was taken out on this home.
Original Mortgage
$57,000
Interest Rate
3.7%
Mortgage Type
New Conventional
Create a Home Valuation Report for This Property
The Home Valuation Report is an in-depth analysis detailing your home's value as well as a comparison with similar homes in the area
Home Values in the Area
Average Home Value in this Area
Purchase History
| Date | Buyer | Sale Price | Title Company |
|---|---|---|---|
| Rogers Adrian John | $95,000 | None Available | |
| Eldgridge Matthew Dennis | -- | None Available | |
| Eldridge Devin | $60,000 | None Available |
Source: Public Records
Mortgage History
| Date | Status | Borrower | Loan Amount |
|---|---|---|---|
| Open | Rogers Adrian John | $93,279 | |
| Previous Owner | Eldridge Devin | $57,000 |
Source: Public Records
Tax History
| Year | Tax Paid | Tax Assessment Tax Assessment Total Assessment is a certain percentage of the fair market value that is determined by local assessors to be the total taxable value of land and additions on the property. | Land | Improvement |
|---|---|---|---|---|
| 2024 | $693 | $4,260 | $1,310 | $2,950 |
| 2023 | $641 | $4,260 | $1,310 | $2,950 |
| 2022 | $603 | $4,260 | $1,310 | $2,950 |
| 2021 | $1,948 | $5,630 | $1,410 | $4,220 |
| 2020 | $2,212 | $6,560 | $1,410 | $5,150 |
| 2019 | $862 | $6,160 | $940 | $5,220 |
| 2018 | $811 | $6,160 | $940 | $5,220 |
| 2017 | -- | $6,160 | $940 | $5,220 |
| 2016 | $785 | $5,760 | $810 | $4,950 |
| 2015 | $832 | $5,760 | $810 | $4,950 |
| 2014 | $822 | $5,760 | $810 | $4,950 |
Source: Public Records
Map
Nearby Homes
- 238 Butler Rd
- 103 Ivy Trail
- 350 Highpoint Rd
- 710 Catbird Ct
- 707 Catbird Ct
- 712 Catbird Ct
- 709 Catbird Ct
- 708 Catbird Ct
- 709 Catbird Ct
- 707 Catbird Ct
- 710 Catbird Ct
- 712 Catbird Ct
- 144 Jericho Cir
- 708 Catbird Ct
- 104 Jericho Cir
- 115 C-6-99
- 111 Hunting Meadow
- 405 Wisteria Ct
- 402 Wisteria Ct
- 307 Jasmine Way
- 104 Mountainview Ct
- 104 Mountain View Ct
- 108 Mountainview Ct
- 105 Mountainview Ct
- 1343 Campbell Rd
- 103 Mountainview Ct
- 404 Butler Rd
- 112 Mountainview Ct
- 1351 Campbell Rd
- 101 Mountainview Ct
- 111 Mountainview Ct
- 1353 Campbell Rd
- 1200 Campbell Rd
- 1216 Whippoorwill Rd
- 1000 Campbell Rd
- 234 Butler Rd
- 1197 Whippoorwill Rd
- 207 Whippoorwill Rd
- 1207 Whippoorwill Rd
- 217 Whippoorwill Rd Unit 1217 Whippoorwill Ro
Your Personal Tour Guide
Ask me questions while you tour the home.