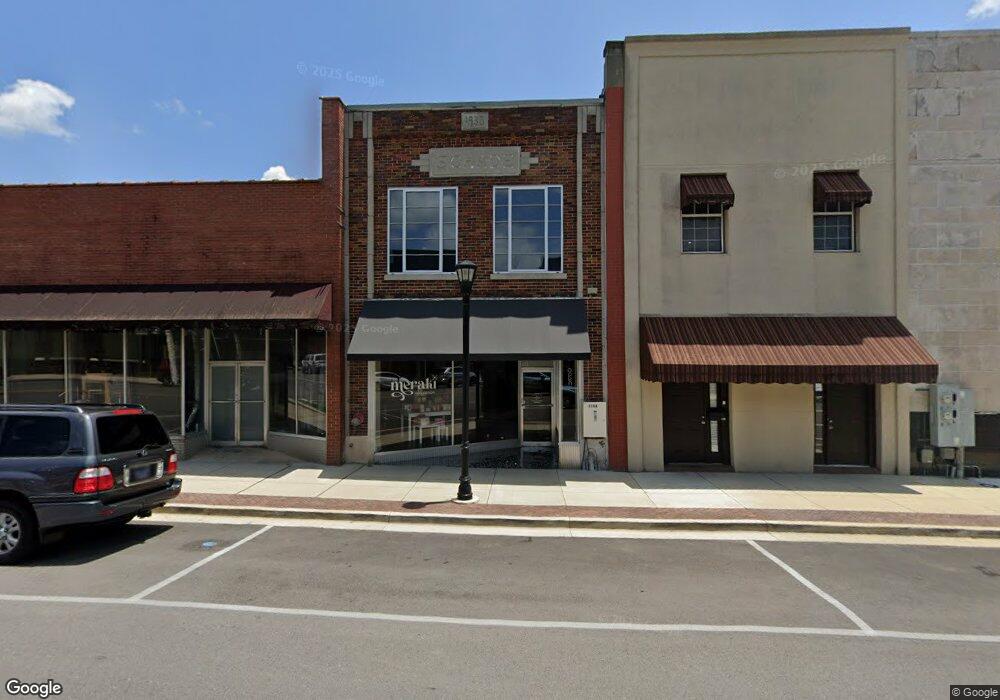
106 N Military Ave Lawrenceburg, TN 38464
Estimated Value: $127,024
--
Bed
1
Bath
3,600
Sq Ft
$35/Sq Ft
Est. Value
About This Home
This home is located at 106 N Military Ave, Lawrenceburg, TN 38464 and is currently estimated at $127,024, approximately $35 per square foot. 106 N Military Ave is a home located in Lawrence County with nearby schools including Ingram Sowell Elementary School, Lawrenceburg Public Elementary School, and David Crockett Elementary School.
Ownership History
Date
Name
Owned For
Owner Type
Purchase Details
Closed on
Sep 5, 2019
Sold by
Hadley Robert Ethan
Bought by
Shedd Stacey and Evers Clinton
Current Estimated Value
Purchase Details
Closed on
Mar 8, 2018
Sold by
Newton James Derric
Bought by
Hadley Robert Ethan
Purchase Details
Closed on
Oct 20, 2016
Sold by
Williams Buel
Bought by
Newton James Derrick
Home Financials for this Owner
Home Financials are based on the most recent Mortgage that was taken out on this home.
Original Mortgage
$37,000
Interest Rate
3.48%
Mortgage Type
Commercial
Purchase Details
Closed on
Jul 9, 2015
Sold by
Williams Buel and Williams Kathy B
Bought by
Williams Buel and Williams Kathy B
Purchase Details
Closed on
Oct 3, 2014
Sold by
Nelson James F
Bought by
Williams Buel and Williams Kathy B
Purchase Details
Closed on
Jan 1, 1982
Bought by
Nelson James F and Wife Edna Joe
Create a Home Valuation Report for This Property
The Home Valuation Report is an in-depth analysis detailing your home's value as well as a comparison with similar homes in the area
Home Values in the Area
Average Home Value in this Area
Purchase History
| Date | Buyer | Sale Price | Title Company |
|---|---|---|---|
| Shedd Stacey | $75,000 | None Available | |
| Hadley Robert Ethan | $70,000 | None Available | |
| Newton James Derrick | $45,000 | -- | |
| Williams Buel | -- | -- | |
| Williams Buel | $36,000 | -- | |
| Nelson James F | $23,000 | -- |
Source: Public Records
Mortgage History
| Date | Status | Borrower | Loan Amount |
|---|---|---|---|
| Previous Owner | Newton James Derrick | $37,000 |
Source: Public Records
Tax History Compared to Growth
Tax History
| Year | Tax Paid | Tax Assessment Tax Assessment Total Assessment is a certain percentage of the fair market value that is determined by local assessors to be the total taxable value of land and additions on the property. | Land | Improvement |
|---|---|---|---|---|
| 2025 | $806 | $25,920 | $0 | $0 |
| 2024 | $806 | $25,920 | $3,600 | $22,320 |
| 2023 | $806 | $25,920 | $3,600 | $22,320 |
| 2022 | $806 | $25,920 | $3,600 | $22,320 |
| 2021 | $1,178 | $26,800 | $3,040 | $23,760 |
| 2020 | $1,178 | $26,800 | $3,040 | $23,760 |
| 2019 | $1,071 | $26,800 | $3,040 | $23,760 |
| 2018 | $673 | $26,800 | $3,040 | $23,760 |
| 2017 | $673 | $15,320 | $3,040 | $12,280 |
| 2016 | $673 | $15,320 | $3,040 | $12,280 |
| 2015 | $638 | $15,320 | $3,040 | $12,280 |
| 2014 | $581 | $13,960 | $3,040 | $10,920 |
Source: Public Records
Map
Nearby Homes
- 213 Pulaski St
- 219 Waterloo St
- 113 W Taylor St
- 215 Depot St
- 316 S Military Ave
- 0 Woodland Dr Unit RTC2772580
- 409 N Military Ave
- 108 Buffalo Rd
- 0 Stewart St
- 511 S Locust Ave
- 222 Groh St
- 220 Jackson Ave
- 220 Lafayette Ave
- 209 Frank St
- 336 Jackson Ave
- 513 Parrish St
- 426 Frank St
- 802 Mahr Ave
- 815 1st Ave
- 806 Fair Ave
- 104 N Military Ave
- 110 N Military Ave
- 1 Public Square
- 120 N Military Ave
- 115 N Military Ave
- 122 N Military Ave
- 47 Public Square
- 9 Public Square
- 202 N Military Ave
- 42 Public Square
- 208 Pulaski St
- 16 Public Square
- 15 Public Square
- 122 E Gaines St
- 137 W Gaines St
- 221 N Columbia Ave
- 129 N Columbia Ave
- 0 N Columbia Ave
- 214 Pulaski St
- 213 N Columbia Ave