106 N Sycamore Ave Sycamore, OH 44882
Estimated payment $782/month
Highlights
- Downtown View
- No HOA
- Level Lot
- Mohawk Elementary School Rated A-
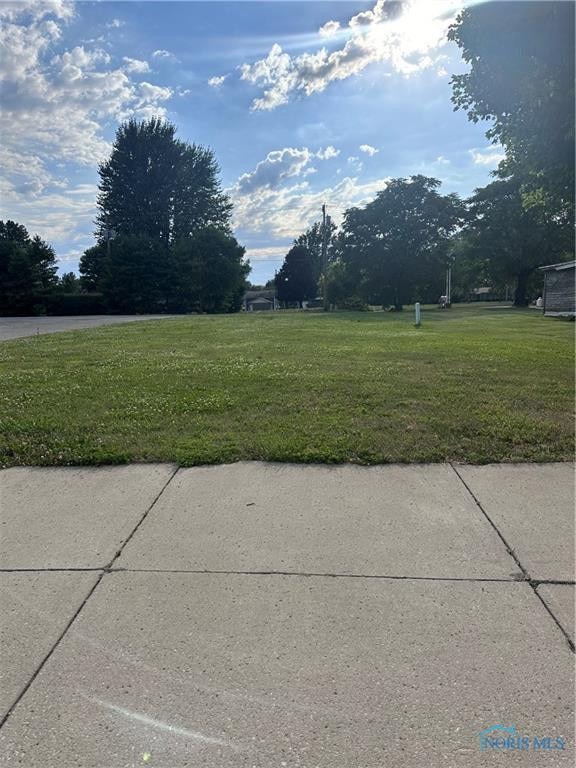
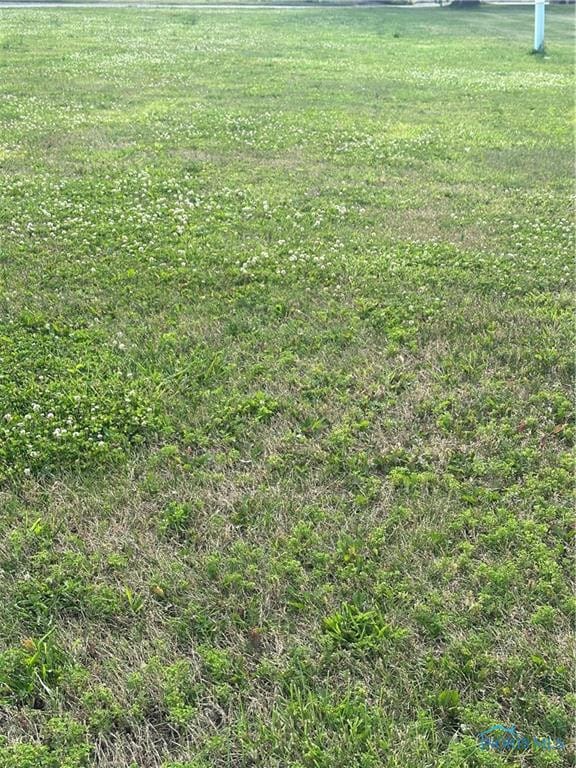
About This Lot
Commercial lot available in town Sycamore. Access at road for utilities.
Property Details
Property Type
- Land
Est. Annual Taxes
- $132
Lot Details
- 8,712 Sq Ft Lot
- Level Lot
- Property is zoned Commercial
Property Views
- Downtown Views
Schools
- Mohawk Elementary School
- None Middle School
- Mohawk High School
Utilities
- Water Not Available
- Sewer Not Available
Community Details
- No Home Owners Association
Listing and Financial Details
- Assessor Parcel Number 37-308500.0000
Map
Home Values in the Area
Average Home Value in this Area
Tax History
| Year | Tax Paid | Tax Assessment Tax Assessment Total Assessment is a certain percentage of the fair market value that is determined by local assessors to be the total taxable value of land and additions on the property. | Land | Improvement |
|---|---|---|---|---|
| 2025 | $198 | $2,730 | $2,730 | $0 |
| 2024 | $132 | $2,730 | $2,730 | $0 |
| 2023 | $132 | $2,730 | $2,730 | $0 |
| 2022 | $135 | $2,730 | $2,730 | $0 |
| 2021 | $133 | $2,730 | $2,730 | $0 |
| 2020 | $136 | $2,730 | $2,730 | $0 |
| 2019 | $135 | $2,730 | $2,730 | $0 |
| 2018 | $151 | $2,940 | $2,940 | $0 |
| 2017 | $154 | $5,460 | $2,940 | $2,520 |
| 2016 | $266 | $5,460 | $2,940 | $2,520 |
| 2015 | -- | $7,810 | $2,940 | $4,870 |
| 2014 | -- | $7,810 | $2,940 | $4,870 |
| 2013 | -- | $7,810 | $2,940 | $4,870 |
Property History
| Date | Event | Price | List to Sale | Price per Sq Ft |
|---|---|---|---|---|
| 06/11/2025 06/11/25 | Price Changed | $147,000 | -2.0% | -- |
| 06/13/2024 06/13/24 | For Sale | $150,000 | -- | -- |
Source: Northwest Ohio Real Estate Information Service (NORIS)
MLS Number: 6116585
APN: 37-308500.0000
Disclaimer: Certain information contained herein is derived from information provided by parties other than Homes.com. All information provided is deemed reliable, but is not guaranteed to be accurate and should be independently verified.
![]() IDX information is provided exclusively for personal, non-commercial use, and may not be used for any purpose other than to identify prospective properties consumers may be interested in purchasing. Information is deemed reliable but not guaranteed. ©2025 NORIS. All rights reserved.
IDX information is provided exclusively for personal, non-commercial use, and may not be used for any purpose other than to identify prospective properties consumers may be interested in purchasing. Information is deemed reliable but not guaranteed. ©2025 NORIS. All rights reserved.
- 204 E 7th St
- 0 Benton St
- 404 S Sycamore Ave
- 305 W 10th St
- 4277 County Highway 134
- 7387 Crawford Wyandot County Line Rd
- 8929 Township Road 1069
- 255 W County Road 6
- 7335 S Township Road 159
- 8915 County Highway 42
- 7160 County Highway 47
- 4432 Marion Melmore Rd
- 6166 County Highway 107
- 0 Township Highway 51
- 167 E Van Meter Dr
- 166 E County Road 16
- 1215 E County Road 16
- 5610 County Highway 330
- 308 Lincoln Hwy
- 10778 County Highway 5
- 305 W 10th St
- 500 Highland Pkwy
- 1045 Halbedel St
- 531 S Patterson St
- 225 1/2 E Findlay St Unit G
- 653 N Sandusky St
- 220 Heritage Cir
- 1325 Whetstone St
- 1779 Whetstone St
- 461 W Lytle St Unit 110
- 1123 Francis Ave Unit 1
- 714 Park Ave Unit 716
- 1017 Ebersole Blvd Unit C
- 601-643 James Marie Ct
- 15105 Birchaven Ln
- 262 Winter Pine Dr
- 2355 Tiffin Ave
- 742 Longmeadow Ln
- 806 Bright Rd
- 798 Carter Dr
