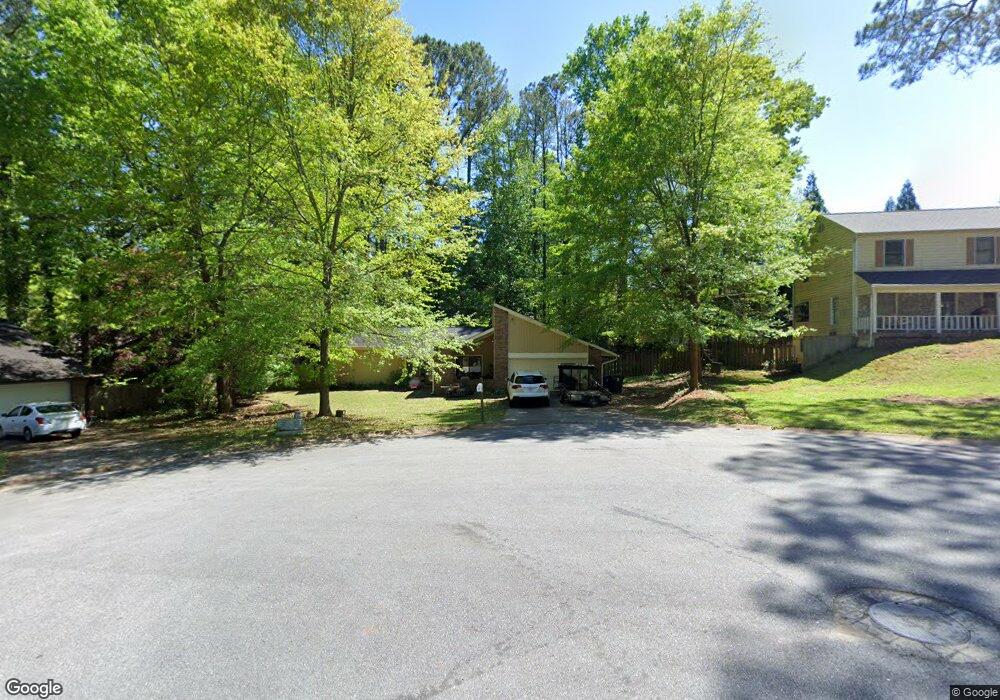
106 Nightwind Ct Peachtree City, GA 30269
Estimated Value: $470,811 - $504,000
3
Beds
2
Baths
1,907
Sq Ft
$255/Sq Ft
Est. Value
About This Home
This home is located at 106 Nightwind Ct, Peachtree City, GA 30269 and is currently estimated at $486,203, approximately $254 per square foot. 106 Nightwind Ct is a home located in Fayette County with nearby schools including Huddleston Elementary School, Booth Middle School, and McIntosh High School.
Ownership History
Date
Name
Owned For
Owner Type
Purchase Details
Closed on
Apr 26, 2016
Sold by
Willis Christopher I
Bought by
Murphy Jonathan T and Murphy Rachel Renee
Current Estimated Value
Home Financials for this Owner
Home Financials are based on the most recent Mortgage that was taken out on this home.
Original Mortgage
$191,920
Outstanding Balance
$153,030
Interest Rate
3.71%
Mortgage Type
New Conventional
Estimated Equity
$333,173
Purchase Details
Closed on
Sep 30, 2004
Sold by
Household Realty Corp
Bought by
Alliance Lending Llc
Home Financials for this Owner
Home Financials are based on the most recent Mortgage that was taken out on this home.
Original Mortgage
$108,750
Interest Rate
5.67%
Mortgage Type
New Conventional
Purchase Details
Closed on
Feb 3, 2004
Sold by
Bierman Howard and Bierman Maria R
Bought by
Household Realty Co
Purchase Details
Closed on
May 31, 1995
Sold by
Graves John Mary Jo
Bought by
Bierman Howard Marla
Create a Home Valuation Report for This Property
The Home Valuation Report is an in-depth analysis detailing your home's value as well as a comparison with similar homes in the area
Home Values in the Area
Average Home Value in this Area
Purchase History
| Date | Buyer | Sale Price | Title Company |
|---|---|---|---|
| Murphy Jonathan T | $239,900 | -- | |
| Alliance Lending Llc | $120,000 | -- | |
| Household Realty Co | $91,869 | -- | |
| Bierman Howard Marla | $100,000 | -- |
Source: Public Records
Mortgage History
| Date | Status | Borrower | Loan Amount |
|---|---|---|---|
| Open | Murphy Jonathan T | $191,920 | |
| Previous Owner | Alliance Lending Llc | $108,750 | |
| Closed | Bierman Howard Marla | $0 |
Source: Public Records
Tax History Compared to Growth
Tax History
| Year | Tax Paid | Tax Assessment Tax Assessment Total Assessment is a certain percentage of the fair market value that is determined by local assessors to be the total taxable value of land and additions on the property. | Land | Improvement |
|---|---|---|---|---|
| 2024 | $5,287 | $178,868 | $29,200 | $149,668 |
| 2023 | $4,513 | $148,760 | $29,200 | $119,560 |
| 2022 | $3,983 | $131,520 | $29,200 | $102,320 |
| 2021 | $3,181 | $103,540 | $17,100 | $86,440 |
| 2020 | $3,320 | $106,940 | $17,100 | $89,840 |
| 2019 | $3,270 | $104,300 | $17,100 | $87,200 |
| 2018 | $2,803 | $87,980 | $17,100 | $70,880 |
| 2017 | $2,718 | $84,740 | $17,100 | $67,640 |
| 2016 | $2,530 | $75,980 | $17,100 | $58,880 |
| 2015 | $2,381 | $70,340 | $17,100 | $53,240 |
| 2014 | $2,301 | $66,780 | $17,100 | $49,680 |
| 2013 | -- | $65,620 | $0 | $0 |
Source: Public Records
Map
Nearby Homes
- 106 Whisper Trace
- 120 Fountain Head
- 107 Fountain Head
- 105 Shadowood Ln
- 214 Windgate Ct
- 105 Highgreen Ridge
- 102 Spincast Ct
- 206 Sandown Dr
- 110 Presidio Park
- 1201 Loxley Cir
- 101 Bluegill Trace
- 1112 Montclair Dr
- 118 Whitfield Run Rd
- 404 Journeys End
- 319 Ruffian Cir Unit 71
- 321 Ruffian Cir Unit 70
- 313 Ruffian Cir Unit 74
- 317 Ruffian Cir Unit 72
- 401 Peachtree Club Dr
- 110 Paddock Trail
- 104 Nightwind Ct
- 109 Cornflower Ct
- 108 Nightwind Ct
- 110 Cornflower Ct
- 105 Strawflower Path
- 107 Cornflower Ct
- 102 Nightwind Ct
- 107 Nightwind Ct
- 103 Strawflower Path
- 105 Nightwind Ct
- 0 Nightwind Ct Unit 7611235
- 108 Cornflower Ct Unit 30B
- 108 Cornflower Ct
- 104 Strawflower Path
- 103 Nightwind Ct Unit 6B
- 103 Nightwind Ct
- 105 Cornflower Ct
- 201 Raintree Bend
- 106 Cornflower Ct
- 203 Raintree Bend