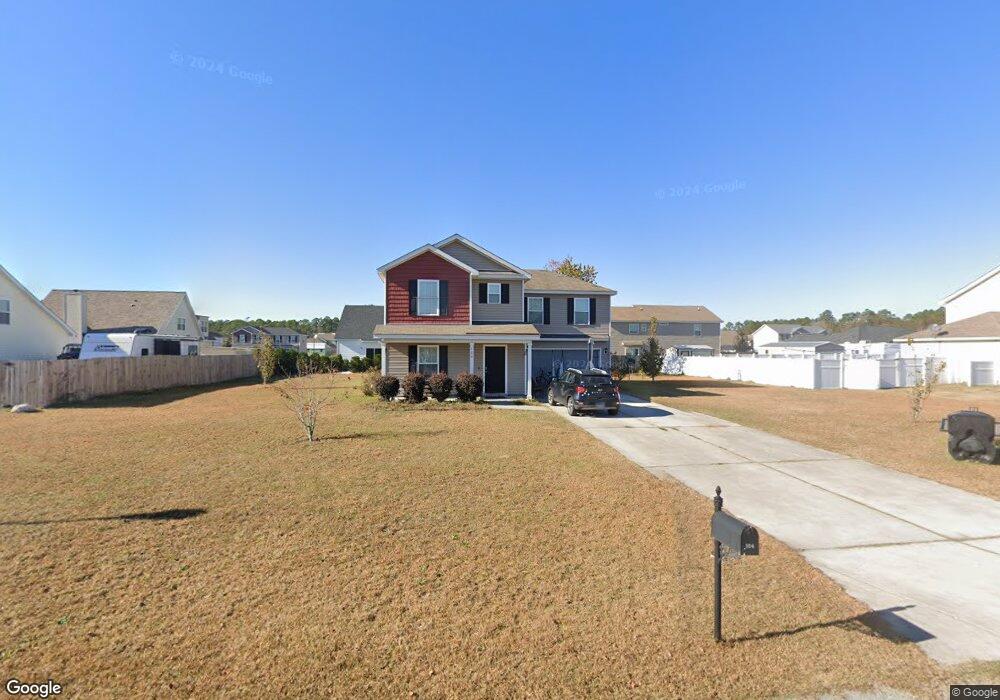
106 Old Mill Rd Guyton, GA 31312
Estimated Value: $348,931 - $375,000
4
Beds
4
Baths
1,899
Sq Ft
$192/Sq Ft
Est. Value
About This Home
This home is located at 106 Old Mill Rd, Guyton, GA 31312 and is currently estimated at $364,483, approximately $191 per square foot. 106 Old Mill Rd is a home located in Effingham County with nearby schools including Marlow Elementary School, South Effingham Middle School, and South Effingham High School.
Ownership History
Date
Name
Owned For
Owner Type
Purchase Details
Closed on
Apr 10, 2015
Sold by
Beacon Builders Inc
Bought by
Doss Shirley A
Current Estimated Value
Home Financials for this Owner
Home Financials are based on the most recent Mortgage that was taken out on this home.
Original Mortgage
$158,710
Outstanding Balance
$122,407
Interest Rate
3.95%
Mortgage Type
VA
Estimated Equity
$242,076
Purchase Details
Closed on
Dec 18, 2014
Sold by
Laurel Mill Inc
Bought by
Beacon Builders Inc
Home Financials for this Owner
Home Financials are based on the most recent Mortgage that was taken out on this home.
Original Mortgage
$126,400
Interest Rate
4.03%
Mortgage Type
New Conventional
Purchase Details
Closed on
Dec 17, 2009
Bought by
Laurel Mill Inc
Create a Home Valuation Report for This Property
The Home Valuation Report is an in-depth analysis detailing your home's value as well as a comparison with similar homes in the area
Home Values in the Area
Average Home Value in this Area
Purchase History
| Date | Buyer | Sale Price | Title Company |
|---|---|---|---|
| Doss Shirley A | $158,710 | -- | |
| Beacon Builders Inc | $19,500 | -- | |
| Laurel Mill Inc | -- | -- |
Source: Public Records
Mortgage History
| Date | Status | Borrower | Loan Amount |
|---|---|---|---|
| Open | Doss Shirley A | $158,710 | |
| Previous Owner | Beacon Builders Inc | $126,400 |
Source: Public Records
Tax History
| Year | Tax Paid | Tax Assessment Tax Assessment Total Assessment is a certain percentage of the fair market value that is determined by local assessors to be the total taxable value of land and additions on the property. | Land | Improvement |
|---|---|---|---|---|
| 2025 | $2,481 | $148,472 | $22,800 | $125,672 |
| 2024 | $2,481 | $148,020 | $22,800 | $125,220 |
| 2023 | $1,647 | $128,272 | $20,800 | $107,472 |
| 2022 | $2,133 | $108,118 | $16,000 | $92,118 |
| 2021 | $2,077 | $93,973 | $14,000 | $79,973 |
| 2020 | $2,049 | $86,062 | $12,000 | $74,062 |
| 2019 | $2,058 | $84,062 | $10,000 | $74,062 |
| 2018 | $2,026 | $75,718 | $10,000 | $65,718 |
| 2017 | $2,028 | $78,975 | $10,000 | $68,975 |
| 2016 | $1,937 | $75,718 | $10,000 | $65,718 |
| 2015 | -- | $8,000 | $8,000 | $0 |
| 2014 | -- | $3,700 | $3,700 | $0 |
| 2013 | -- | $3,500 | $3,500 | $0 |
Source: Public Records
Map
Nearby Homes
- 111 Gleaston Way
- 241 Freedom Trail
- 222 Freedom Trail
- 146 Nease Rd
- 109 Bryan Way
- 3246 Midland Rd
- 679 Majestic Dr
- 675 Majestic Dr
- 110 Little Ben Ct
- 114 Little Ben Ct
- 108 Little Ben Ct
- 116 Little Ben Ct
- 102 Little Ben Ct
- 633 Majestic Dr
- 118 Little Ben Ct
- 777 Zittrouer Rd
- 121 Little Ben Ct
- 695 Majestic Dr
- 875 Zittrouer Rd
- 112 Little Ben Ct
- 108 Old Mill Rd
- 104 Old Mill Rd
- 107 Springcreek Ln
- 105 Springcreek Ln
- 109 Springcreek Ln
- 107 Old Mill Rd
- 111 Old Mill Rd
- 103 Springcreek Ln
- 110 Old Mill Rd
- 102 Old Mill Rd
- 105 Old Mill Rd
- 111 Springcreek Ln
- 113 Old Mill Rd
- 106 Springcreek Ln
- 104 Springcreek Ln
- 128 Laurel Ln
- 108 Springcreek Ln
- 124 Laurel Ln
- 101 Springcreek Ln
- 103 Old Mill Rd
Your Personal Tour Guide
Ask me questions while you tour the home.