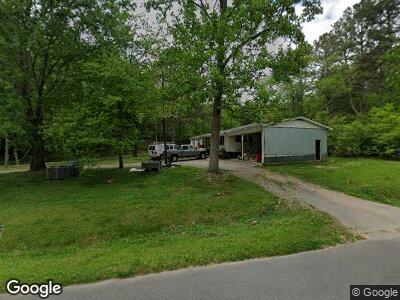
106 Old Trion Rd La Fayette, GA 30728
LaFayette NeighborhoodEstimated Value: $258,340 - $314,000
--
Bed
2
Baths
1,774
Sq Ft
$162/Sq Ft
Est. Value
About This Home
This home is located at 106 Old Trion Rd, La Fayette, GA 30728 and is currently estimated at $286,835, approximately $161 per square foot. 106 Old Trion Rd is a home located in Walker County with nearby schools including North Lafayette Elementary School, Lafayette Middle School, and Lafayette High School.
Ownership History
Date
Name
Owned For
Owner Type
Purchase Details
Closed on
Jul 25, 2016
Sold by
Diane M
Bought by
Gaskey Michael Anthony and Diane Gaskey M
Current Estimated Value
Purchase Details
Closed on
Dec 15, 2011
Sold by
Gaskey Michael
Bought by
Lankford Michael Anthony
Purchase Details
Closed on
Aug 30, 2005
Sold by
Gaskey M Diane
Bought by
Gaskey Martha Diane and Gaskey Michael
Home Financials for this Owner
Home Financials are based on the most recent Mortgage that was taken out on this home.
Original Mortgage
$178,500
Interest Rate
7.85%
Mortgage Type
New Conventional
Purchase Details
Closed on
Mar 31, 2004
Sold by
Parris Freddie C
Bought by
Gaskey M Diane
Purchase Details
Closed on
Nov 10, 1989
Bought by
Parris Freddie C
Create a Home Valuation Report for This Property
The Home Valuation Report is an in-depth analysis detailing your home's value as well as a comparison with similar homes in the area
Home Values in the Area
Average Home Value in this Area
Purchase History
| Date | Buyer | Sale Price | Title Company |
|---|---|---|---|
| Gaskey Michael Anthony | -- | -- | |
| Lankford Michael Anthony | -- | -- | |
| Gaskey Martha Diane | -- | -- | |
| Gaskey M Diane | $26,000 | -- | |
| Parris Freddie C | $7,000 | -- |
Source: Public Records
Mortgage History
| Date | Status | Borrower | Loan Amount |
|---|---|---|---|
| Open | Gaskey Michael A | $260,480 | |
| Previous Owner | Gaskey Martha Diane | $224,632 | |
| Previous Owner | Lankford Michael Anthony | $6,250 | |
| Previous Owner | Gaskey Martha Diane | $23,181 | |
| Previous Owner | Gaskey Martha Diane | $178,500 |
Source: Public Records
Tax History Compared to Growth
Tax History
| Year | Tax Paid | Tax Assessment Tax Assessment Total Assessment is a certain percentage of the fair market value that is determined by local assessors to be the total taxable value of land and additions on the property. | Land | Improvement |
|---|---|---|---|---|
| 2024 | $2,096 | $92,982 | $16,604 | $76,378 |
| 2023 | $1,976 | $85,422 | $13,177 | $72,245 |
| 2022 | $1,795 | $71,631 | $9,869 | $61,762 |
| 2021 | $1,719 | $61,954 | $9,869 | $52,085 |
| 2020 | $1,450 | $49,704 | $9,869 | $39,835 |
| 2019 | $1,476 | $49,704 | $9,869 | $39,835 |
| 2018 | $1,315 | $49,704 | $9,869 | $39,835 |
| 2017 | $1,613 | $49,704 | $9,869 | $39,835 |
| 2016 | $1,297 | $49,704 | $9,869 | $39,835 |
| 2015 | $1,317 | $47,566 | $8,176 | $39,390 |
| 2014 | $1,215 | $47,566 | $8,176 | $39,390 |
| 2013 | -- | $47,566 | $8,176 | $39,390 |
Source: Public Records
Map
Nearby Homes
- 2280 Us Highway 27
- 0 Foster Mill Dr Unit 11496522
- 0 Us Highway 27
- 0 Shattuck Industrial Blvd Unit 11498739
- 101 Johnson St
- 104 Johnson St
- 0 Crest Dr Unit 10499874
- 0 Crest Dr Unit 1511011
- 169 Lake Terrace Cir
- 157 Lake Terrace Cir
- 2972 U S 27
- 23 Cook St
- 179 Lake Terrace Dr
- 38 Fitzpatrick Dr
- 32 Sequoia Cir
- 91 Lee Edwards Dr
- 93 Oconee Cir
- 175 Stiles Ln
- 100 Lake Terrace Dr
- 122 Pledger St
- 106 Old Trion Rd
- 217 Trion Spur Rd
- 171 Trion Rd
- 0 Old Trion Hwy Unit 10120460
- 0 Old Trion Hwy Unit 10120471
- 0 Old Trion Hwy Unit 1118165
- 0 Old Trion Hwy Unit 1099005
- 0 Old Trion Hwy Unit 1084913
- 0 Old Trion Hwy Unit 1072816
- 0 Old Trion Hwy Unit 1138119
- 0 Old Trion Hwy Unit 8260127
- 0 Old Trion Hwy Unit 9061709
- 0 Old Trion Hwy Unit 9061700
- 0 Old Trion Hwy Unit 9061692
- 0 Old Trion Hwy Unit 9061685
- 0 Old Trion Hwy Unit 1333680
- 0 Old Trion Hwy Unit 3179931
- 0 Old Trion Hwy Unit 7037956
- 76 Old Trion Rd
- 166 Old Trion Rd