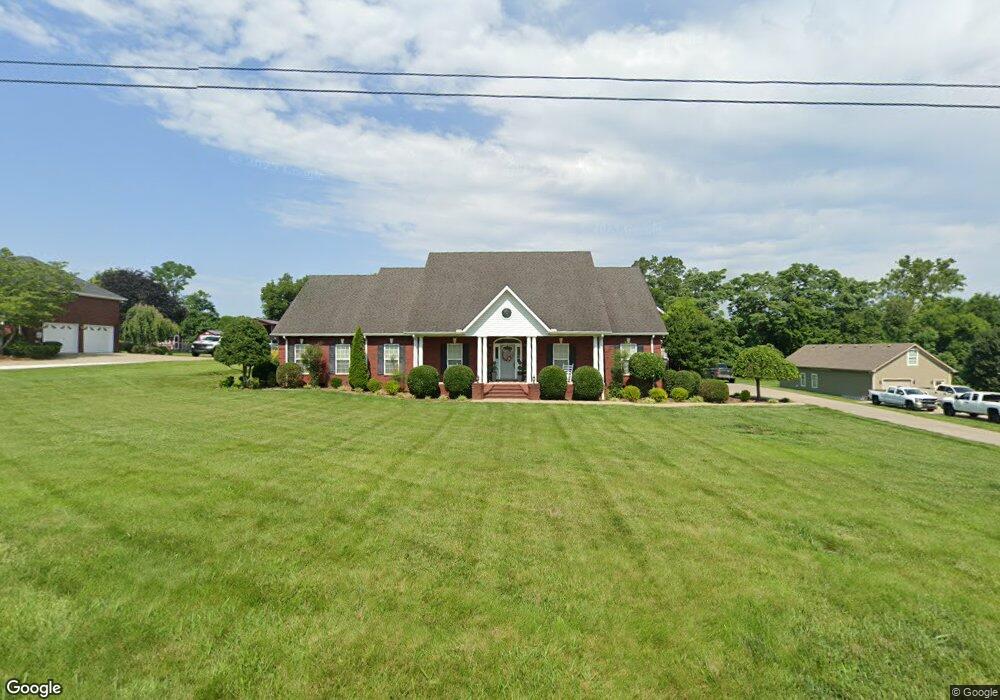
106 Peggy Ln Shelbyville, TN 37160
Estimated Value: $551,000 - $727,000
--
Bed
3
Baths
3,215
Sq Ft
$194/Sq Ft
Est. Value
About This Home
This home is located at 106 Peggy Ln, Shelbyville, TN 37160 and is currently estimated at $624,221, approximately $194 per square foot. 106 Peggy Ln is a home located in Bedford County with nearby schools including Liberty Elementary School.
Ownership History
Date
Name
Owned For
Owner Type
Purchase Details
Closed on
Jun 28, 2002
Sold by
Jones Billy W
Bought by
Green Jeffrey T and Green Jamie E
Current Estimated Value
Home Financials for this Owner
Home Financials are based on the most recent Mortgage that was taken out on this home.
Original Mortgage
$14,600
Interest Rate
6.75%
Purchase Details
Closed on
Feb 25, 2002
Sold by
Dunnam Carole C
Bought by
Jones Billy W
Purchase Details
Closed on
Dec 30, 1997
Bought by
Jones Billy W and Jones Carole
Purchase Details
Closed on
Apr 14, 1976
Bought by
Daniel Bill
Create a Home Valuation Report for This Property
The Home Valuation Report is an in-depth analysis detailing your home's value as well as a comparison with similar homes in the area
Home Values in the Area
Average Home Value in this Area
Purchase History
| Date | Buyer | Sale Price | Title Company |
|---|---|---|---|
| Green Jeffrey T | $16,000 | -- | |
| Jones Billy W | $20,000 | -- | |
| Jones Billy W | $20,000 | -- | |
| Duncan Joy | $15,000 | -- | |
| Daniel Bill | -- | -- |
Source: Public Records
Mortgage History
| Date | Status | Borrower | Loan Amount |
|---|---|---|---|
| Closed | Daniel Bill | $14,600 |
Source: Public Records
Tax History Compared to Growth
Tax History
| Year | Tax Paid | Tax Assessment Tax Assessment Total Assessment is a certain percentage of the fair market value that is determined by local assessors to be the total taxable value of land and additions on the property. | Land | Improvement |
|---|---|---|---|---|
| 2025 | $2,888 | $124,200 | $0 | $0 |
| 2024 | $2,888 | $124,200 | $7,000 | $117,200 |
| 2023 | $2,888 | $124,200 | $7,000 | $117,200 |
| 2022 | $2,888 | $124,200 | $7,000 | $117,200 |
| 2021 | $2,402 | $124,200 | $7,000 | $117,200 |
| 2020 | $2,503 | $122,250 | $7,000 | $115,250 |
| 2019 | $2,503 | $94,100 | $5,625 | $88,475 |
| 2018 | $2,409 | $94,100 | $5,625 | $88,475 |
| 2017 | $2,220 | $86,725 | $5,625 | $81,100 |
| 2016 | $2,185 | $86,725 | $5,625 | $81,100 |
| 2015 | $2,185 | $86,725 | $5,625 | $81,100 |
| 2014 | $1,730 | $76,219 | $0 | $0 |
Source: Public Records
Map
Nearby Homes