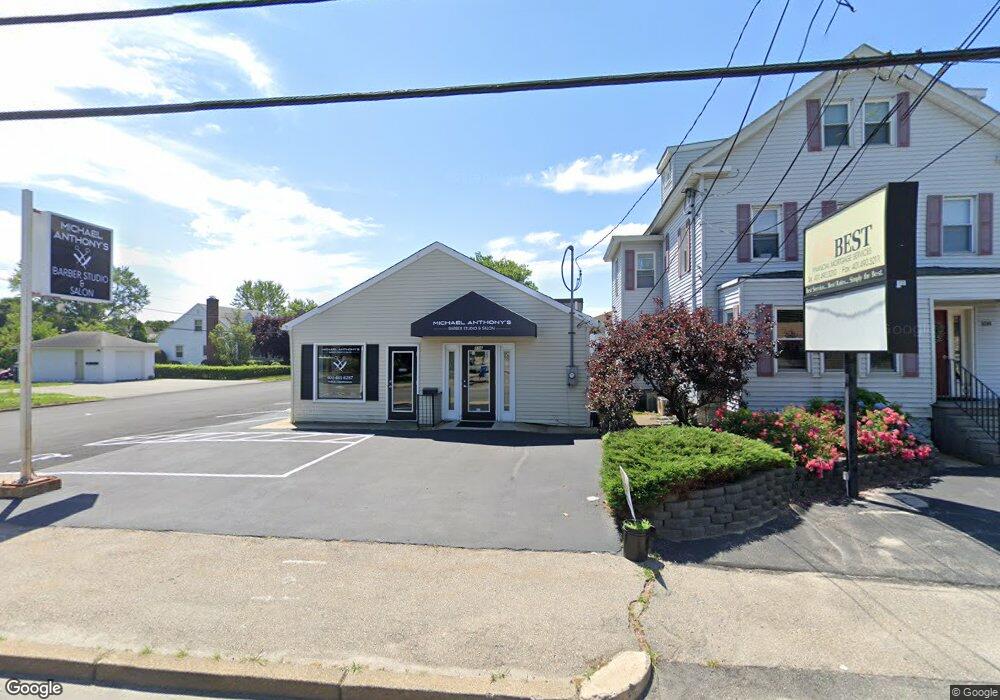
106 Phenix Ave Cranston, RI 02920
Knightsville NeighborhoodEstimated Value: $458,066
--
Bed
--
Bath
1,188
Sq Ft
$386/Sq Ft
Est. Value
About This Home
This home is located at 106 Phenix Ave, Cranston, RI 02920 and is currently estimated at $458,066, approximately $385 per square foot. 106 Phenix Ave is a home located in Providence County with nearby schools including George J. Peters School, Western Hills Middle School, and Cranston High School West.
Ownership History
Date
Name
Owned For
Owner Type
Purchase Details
Closed on
Mar 6, 2000
Sold by
Bilda Bros Llc
Bought by
Celeste Properties Llc
Current Estimated Value
Purchase Details
Closed on
Dec 4, 1997
Sold by
Colagiovanni Vincent A
Bought by
Bilda Bros Llc
Home Financials for this Owner
Home Financials are based on the most recent Mortgage that was taken out on this home.
Original Mortgage
$30,000
Interest Rate
7.28%
Mortgage Type
Commercial
Create a Home Valuation Report for This Property
The Home Valuation Report is an in-depth analysis detailing your home's value as well as a comparison with similar homes in the area
Home Values in the Area
Average Home Value in this Area
Purchase History
| Date | Buyer | Sale Price | Title Company |
|---|---|---|---|
| Celeste Properties Llc | $123,000 | -- | |
| Bilda Bros Llc | $89,000 | -- |
Source: Public Records
Mortgage History
| Date | Status | Borrower | Loan Amount |
|---|---|---|---|
| Previous Owner | Bilda Bros Llc | $30,000 |
Source: Public Records
Tax History Compared to Growth
Tax History
| Year | Tax Paid | Tax Assessment Tax Assessment Total Assessment is a certain percentage of the fair market value that is determined by local assessors to be the total taxable value of land and additions on the property. | Land | Improvement |
|---|---|---|---|---|
| 2025 | $4,724 | $226,900 | $96,300 | $130,600 |
| 2024 | $4,633 | $226,900 | $96,300 | $130,600 |
| 2023 | $5,174 | $182,500 | $82,600 | $99,900 |
| 2022 | $5,068 | $182,500 | $82,600 | $99,900 |
| 2021 | $4,928 | $182,500 | $82,600 | $99,900 |
| 2020 | $5,082 | $163,100 | $75,400 | $87,700 |
| 2019 | $5,082 | $163,100 | $75,400 | $87,700 |
| 2018 | $4,965 | $163,100 | $75,400 | $87,700 |
| 2017 | $5,051 | $146,800 | $68,800 | $78,000 |
| 2016 | $4,944 | $146,800 | $68,800 | $78,000 |
| 2015 | $4,944 | $146,800 | $68,800 | $78,000 |
| 2014 | $4,632 | $135,200 | $68,800 | $66,400 |
Source: Public Records
Map
Nearby Homes