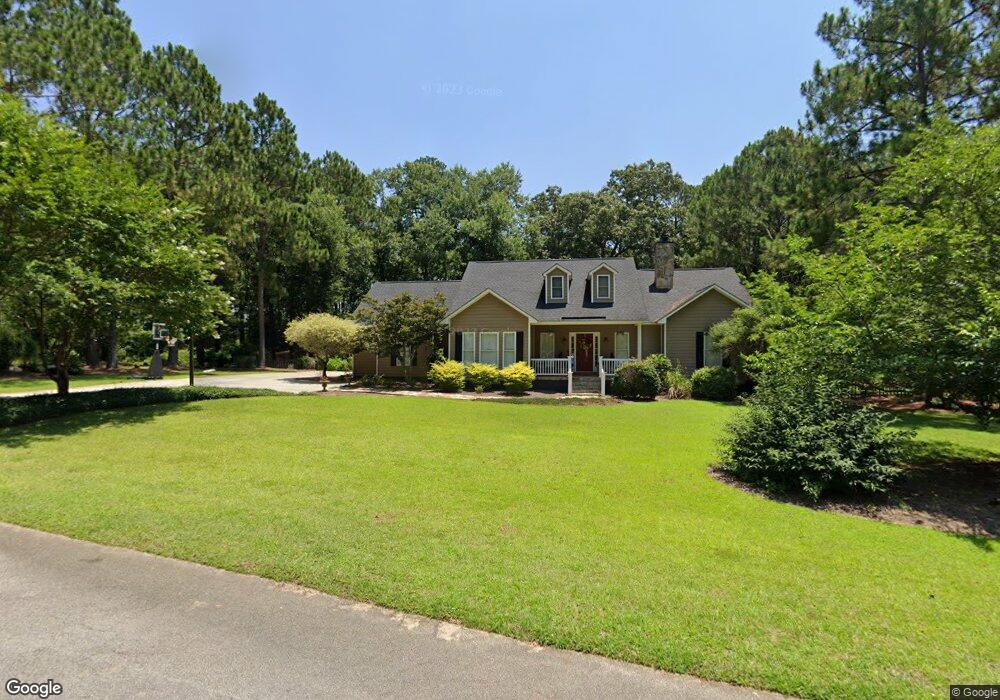
106 Pine Ct Cordele, GA 31015
Estimated Value: $201,000 - $301,000
3
Beds
3
Baths
1,600
Sq Ft
$161/Sq Ft
Est. Value
About This Home
This home is located at 106 Pine Ct, Cordele, GA 31015 and is currently estimated at $257,634, approximately $161 per square foot. 106 Pine Ct is a home located in Crisp County with nearby schools including Crisp County Elementary School, Crisp County Primary School, and Crisp County Middle School.
Ownership History
Date
Name
Owned For
Owner Type
Purchase Details
Closed on
Sep 7, 2020
Sold by
Gibbs Teresa Adams
Bought by
Smith Stephanie Dowdy
Current Estimated Value
Home Financials for this Owner
Home Financials are based on the most recent Mortgage that was taken out on this home.
Original Mortgage
$200,000
Interest Rate
5.22%
Mortgage Type
Mortgage Modification
Purchase Details
Closed on
Mar 11, 2014
Sold by
Gibbs Teresa Adams
Bought by
Gibbs Teresa Adams
Purchase Details
Closed on
Mar 20, 2008
Sold by
Gibbs Teresa A
Bought by
Gibbs Teresa A and Gibbs Ronnie L
Purchase Details
Closed on
Jun 10, 1999
Sold by
Gibbs Ronnie L
Bought by
Gibbs Ronnie L and Gibbs Te
Create a Home Valuation Report for This Property
The Home Valuation Report is an in-depth analysis detailing your home's value as well as a comparison with similar homes in the area
Home Values in the Area
Average Home Value in this Area
Purchase History
| Date | Buyer | Sale Price | Title Company |
|---|---|---|---|
| Smith Stephanie Dowdy | $250,000 | -- | |
| Smith Stephanie Dowdy | $250,000 | -- | |
| Gibbs Teresa Adams | -- | -- | |
| Gibbs Teresa A | -- | -- | |
| Gibbs Ronnie L | -- | -- | |
| Gibbs Ronnie L | $28,900 | -- |
Source: Public Records
Mortgage History
| Date | Status | Borrower | Loan Amount |
|---|---|---|---|
| Previous Owner | Smith Stephanie Dowdy | $200,000 |
Source: Public Records
Tax History Compared to Growth
Tax History
| Year | Tax Paid | Tax Assessment Tax Assessment Total Assessment is a certain percentage of the fair market value that is determined by local assessors to be the total taxable value of land and additions on the property. | Land | Improvement |
|---|---|---|---|---|
| 2024 | $2,387 | $88,163 | $6,000 | $82,163 |
| 2023 | $2,395 | $85,265 | $6,000 | $79,265 |
| 2022 | $1,754 | $77,929 | $6,000 | $71,929 |
| 2021 | $2,031 | $68,489 | $6,000 | $62,489 |
| 2020 | $1,571 | $68,489 | $6,000 | $62,489 |
| 2019 | $1,559 | $68,489 | $6,000 | $62,489 |
| 2018 | $1,343 | $59,536 | $8,000 | $51,536 |
| 2017 | $1,831 | $59,536 | $8,000 | $51,536 |
| 2016 | $1,347 | $59,536 | $8,000 | $51,536 |
| 2015 | -- | $59,536 | $8,000 | $51,536 |
| 2014 | -- | $59,536 | $8,000 | $51,536 |
| 2013 | -- | $59,535 | $8,000 | $51,535 |
Source: Public Records
Map
Nearby Homes
- 304 Timberland Dr
- 1022 E 29th Ave
- 2115 Royal Rd
- 157 Bobwhite Dr
- 724 E 26th Ave
- 615 E 28th Ave
- 618 E 27th Ave
- 607 E 27th Ave
- 619 E 26th Ave
- 723 E 24th Ave
- 1101 Schley Ave
- 510 E 25th Ave
- 912 Rose Ln
- 1001 Stewart Ave
- 0 Pecan St S
- 616 E 23rd Ave
- 1509 E 20th Ave
- 1606 S 5th St
- 2298 U S 41
- 1002 Camellia Dr
- 6 Carson Dr
- 5 Carson Dr
- 141 Carson Dr
- 111 Pine Ct
- 102 Slash Cir
- 108 Slash Cir
- 103 Loblolly St
- 105 Slash Cir
- 155 Carson Dr
- 510 Timberland Dr
- 508 Timberland Dr
- 117 Loblolly St
- 506 Timberland Dr
- 1977 Royal Rd
- 1977 Royal Rd Unit 1
- 602 Timberland Dr
- 104 Loblolly St
- 109 Live Oak Ln
- Lot 5 N Timberland Blk A
- Lot 6 N Timberland Blk A