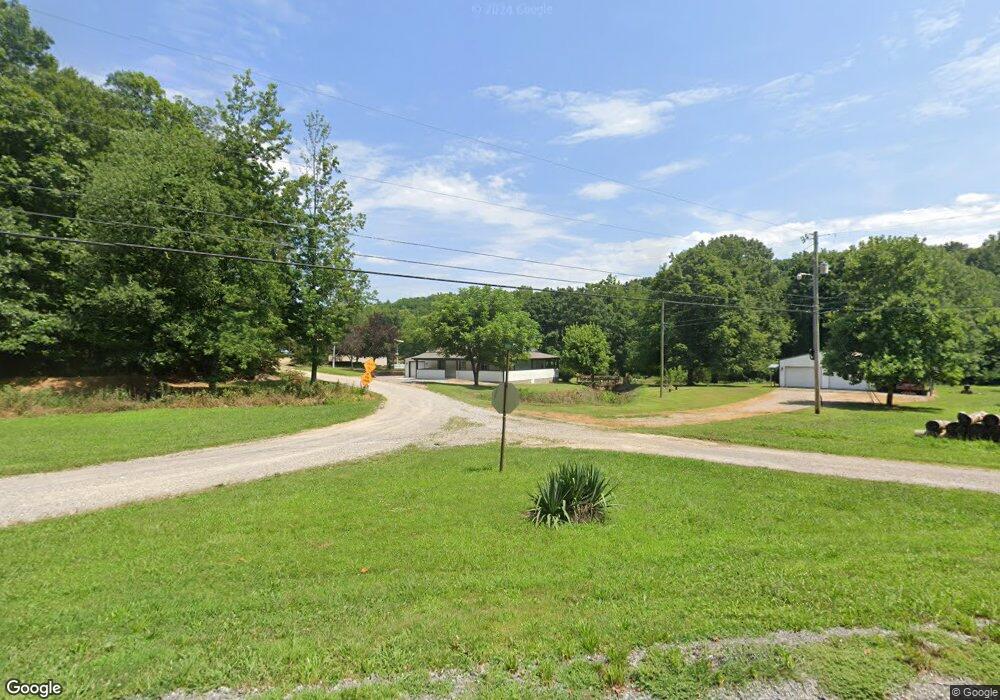
106 Rainwater Rd Stewart, TN 37175
Estimated Value: $363,000 - $514,502
--
Bed
2
Baths
1,728
Sq Ft
$254/Sq Ft
Est. Value
About This Home
This home is located at 106 Rainwater Rd, Stewart, TN 37175 and is currently estimated at $438,751, approximately $253 per square foot. 106 Rainwater Rd is a home located in Stewart County with nearby schools including Dover Elementary School, Stewart County Middle School, and Stewart County High School.
Ownership History
Date
Name
Owned For
Owner Type
Purchase Details
Closed on
Sep 10, 2024
Sold by
Gorde Christian Lee and Gorde Helen Ann
Bought by
Christian And Helen Gorde Living Trust and Gorde
Current Estimated Value
Purchase Details
Closed on
Mar 2, 2022
Sold by
Rainwater William M and Rainwater Anna M
Bought by
Gorde Chris and Gorde Helen Ann
Purchase Details
Closed on
May 11, 2005
Sold by
Not Provided
Bought by
Gorde Christian L
Home Financials for this Owner
Home Financials are based on the most recent Mortgage that was taken out on this home.
Original Mortgage
$133,500
Interest Rate
5.8%
Mortgage Type
New Conventional
Purchase Details
Closed on
Jul 23, 1992
Bought by
Lewis Lawrence P and Lewis Shirley M
Purchase Details
Closed on
Aug 19, 1971
Bought by
Reynolds Howard and Reynolds Ida
Create a Home Valuation Report for This Property
The Home Valuation Report is an in-depth analysis detailing your home's value as well as a comparison with similar homes in the area
Home Values in the Area
Average Home Value in this Area
Purchase History
| Date | Buyer | Sale Price | Title Company |
|---|---|---|---|
| Christian And Helen Gorde Living Trust | -- | Stewart Title | |
| Gorde Chris | -- | None Listed On Document | |
| Gorde Christian L | $150,000 | -- | |
| Lewis Lawrence P | $34,500 | -- | |
| Reynolds Howard | -- | -- |
Source: Public Records
Mortgage History
| Date | Status | Borrower | Loan Amount |
|---|---|---|---|
| Previous Owner | Gorde Christian L | $133,500 |
Source: Public Records
Tax History Compared to Growth
Tax History
| Year | Tax Paid | Tax Assessment Tax Assessment Total Assessment is a certain percentage of the fair market value that is determined by local assessors to be the total taxable value of land and additions on the property. | Land | Improvement |
|---|---|---|---|---|
| 2025 | $2,242 | $150,875 | $0 | $0 |
| 2024 | $2,242 | $150,875 | $40,200 | $110,675 |
| 2023 | $1,533 | $64,950 | $18,925 | $46,025 |
| 2022 | $1,485 | $62,900 | $18,925 | $43,975 |
| 2021 | $1,485 | $62,900 | $18,925 | $43,975 |
| 2020 | $1,660 | $62,900 | $18,925 | $43,975 |
| 2019 | $1,660 | $65,125 | $23,875 | $41,250 |
| 2018 | $1,660 | $65,125 | $23,875 | $41,250 |
| 2017 | $1,660 | $65,125 | $23,875 | $41,250 |
| 2016 | $1,660 | $65,125 | $23,875 | $41,250 |
| 2015 | $1,609 | $65,125 | $23,875 | $41,250 |
| 2014 | $1,624 | $64,675 | $23,875 | $40,800 |
| 2013 | $1,624 | $65,768 | $0 | $0 |
Source: Public Records
Map
Nearby Homes
- 0 Old Hwy 18
- N Fork Rd
- 0 N Fork Rd Unit RTC2810696
- 0 Old Highway 18 Unit 24351588
- 0 Old Highway 18 Unit RTC2969875
- 0 Old Highway 18 Unit RTC2964512
- 0 Old Highway 18 Unit RTC2969861
- 0 Old Highway 18 Unit RTC2969910
- 0 Settle Rd
- 0 Hurricane Rd NE Unit RTC2762788
- 0 Hurricane Rd SE Unit RTC2762799
- 0 Hurricane Rd SE Unit RTC2762795
- 0 Hurricane Rd SE Unit RTC2762797
- 0 Les Ferrell Rd
- 01 Terrapin Run Rd
- 1 Terrapin Run Rd
- 2 Highway 232
- 8 Highway 232
- 2741 Highway 232
- 4 Highway 232
- 1735 Leatherwood Rd
- 111 Hurricane Creek Rd
- 0 Hurricane Landing Rd
- 163 Rainwater Rd
- 152 Hurricane Creek Rd
- 168 Rainwater Rd
- 110 Hurricane Creek Rd
- 1951 Leatherwood Rd Unit 1937
- 181 Rainwater Rd
- 1944 Leatherwood Rd
- 195 Rainwater Rd
- 1999 Leatherwood Rd
- 2144 Leatherwood Rd
- 115 Parker Ln
- 1994 Leatherwood Rd
- 2005 Leatherwood Rd
- 2022 Leatherwood Rd
- 207 Parker Ln
- 172 Maddox Rd
- 2061 Leatherwood Rd