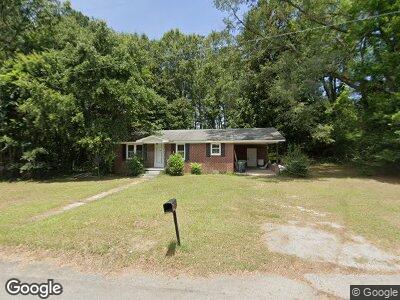
106 Roberts St Eastover, SC 29044
Estimated Value: $66,000 - $115,000
3
Beds
1
Bath
1,073
Sq Ft
$92/Sq Ft
Est. Value
About This Home
This home is located at 106 Roberts St, Eastover, SC 29044 and is currently estimated at $98,333, approximately $91 per square foot. 106 Roberts St is a home located in Richland County with nearby schools including Southeast Middle School and Lower Richland High School.
Ownership History
Date
Name
Owned For
Owner Type
Purchase Details
Closed on
Mar 4, 2016
Sold by
35K Llc
Bought by
Scott Lalicia
Current Estimated Value
Purchase Details
Closed on
Feb 16, 2016
Sold by
Richland County
Bought by
35K Llc
Purchase Details
Closed on
Feb 18, 2010
Sold by
Wood Derek B and Wood Janelle
Bought by
St Julien Rene and St Julien Madeline
Home Financials for this Owner
Home Financials are based on the most recent Mortgage that was taken out on this home.
Original Mortgage
$59,183
Interest Rate
4.97%
Mortgage Type
New Conventional
Purchase Details
Closed on
Dec 18, 2007
Sold by
Ushman Kevin
Bought by
Wood Derek B and Wood Janelle
Home Financials for this Owner
Home Financials are based on the most recent Mortgage that was taken out on this home.
Original Mortgage
$51,300
Interest Rate
6.22%
Mortgage Type
Purchase Money Mortgage
Purchase Details
Closed on
Oct 25, 2004
Sold by
Nidiffer David B
Bought by
Ushman Kevin
Create a Home Valuation Report for This Property
The Home Valuation Report is an in-depth analysis detailing your home's value as well as a comparison with similar homes in the area
Home Values in the Area
Average Home Value in this Area
Purchase History
| Date | Buyer | Sale Price | Title Company |
|---|---|---|---|
| Scott Lalicia | $19,500 | None Available | |
| 35K Llc | $5,711 | -- | |
| St Julien Rene | $55,000 | -- | |
| Wood Derek B | $53,900 | None Available | |
| Ushman Kevin | -- | -- |
Source: Public Records
Mortgage History
| Date | Status | Borrower | Loan Amount |
|---|---|---|---|
| Previous Owner | St Julien Rene | $59,183 | |
| Previous Owner | Wood Derek B | $51,300 | |
| Previous Owner | Wood Derek B | $2,000 | |
| Previous Owner | Wood Derek B | $3,000 | |
| Previous Owner | Ushman Kevin | $51,200 |
Source: Public Records
Tax History Compared to Growth
Tax History
| Year | Tax Paid | Tax Assessment Tax Assessment Total Assessment is a certain percentage of the fair market value that is determined by local assessors to be the total taxable value of land and additions on the property. | Land | Improvement |
|---|---|---|---|---|
| 2023 | $997 | $0 | $0 | $0 |
| 2021 | $883 | $1,250 | $0 | $0 |
| 2020 | $904 | $1,250 | $0 | $0 |
| 2019 | $904 | $1,250 | $0 | $0 |
| 2018 | $840 | $1,180 | $0 | $0 |
| 2017 | $824 | $1,180 | $0 | $0 |
| 2016 | $1,559 | $3,260 | $0 | $0 |
| 2015 | $1,538 | $3,260 | $0 | $0 |
| 2014 | $1,508 | $54,300 | $0 | $0 |
| 2013 | -- | $3,260 | $0 | $0 |
Source: Public Records
Map
Nearby Homes
- 112 Roberts
- 404 Sandhill Rd
- 117 Gilmore St
- 441 Main St
- 136 Dowdy St
- 120 Joyner
- 000 Vanboklen Rd
- 239 House Rd
- 212 Sunny Acres Rd
- 114 Sunny Acres Rd
- 216 Sunny Acres Rd
- 214 Sunny Acres Rd
- 300 Sunny Acres Rd
- 302 Sunny Acres Rd
- 1159 Hickory Hill Rd
- 112 Hallwood Rd
- 165 Raven Brook Rd
- N/S Hallwood Rd
- 000 Community Pond Rd
- 1001 Lincoln Park Dr
- 106 Roberts St
- 106 Roberts St
- 517 Sandhill Rd
- 501 Sandhill Rd
- 513 Sandhill Rd
- 305 Holt St
- 508 Sandhill Rd
- 520 Sandhill Rd
- 301 Holt St
- 410 Sandhill Rd
- 512 Sandhill Rd
- 528 Sandhill Rd
- 104 Gilmore St
- 0 Holt St
- 108 Gilmore St
- 308 Sandhill Rd
- 301 Sandhill Rd
- 0 Nelson St Unit 452855
- 0 Nelson St Unit 430097
- 1108 Nelson St