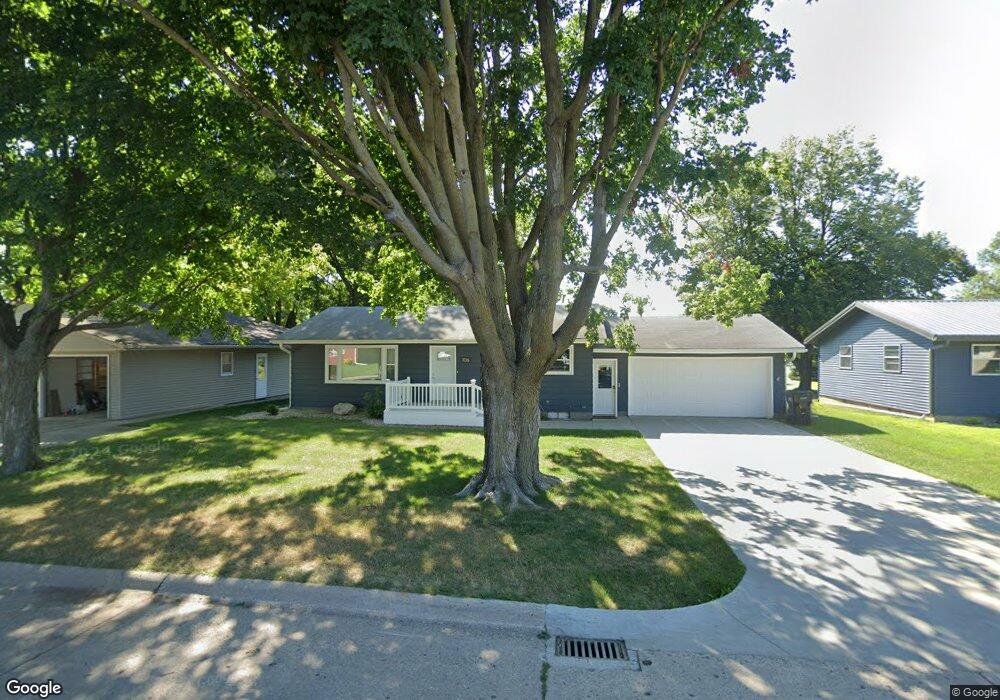
106 S Oak St Marcus, IA 51035
Estimated Value: $163,000 - $207,000
2
Beds
3
Baths
1,064
Sq Ft
$168/Sq Ft
Est. Value
About This Home
This home is located at 106 S Oak St, Marcus, IA 51035 and is currently estimated at $178,681, approximately $167 per square foot. 106 S Oak St is a home located in Cherokee County with nearby schools including MMCRU Marcus Elementary School and MMCRU High School.
Ownership History
Date
Name
Owned For
Owner Type
Purchase Details
Closed on
Jun 26, 2024
Sold by
Nelson Erik and Nelson Emily
Bought by
Frederes Tyler
Current Estimated Value
Home Financials for this Owner
Home Financials are based on the most recent Mortgage that was taken out on this home.
Original Mortgage
$140,000
Outstanding Balance
$138,213
Interest Rate
7.02%
Mortgage Type
Credit Line Revolving
Estimated Equity
$40,468
Purchase Details
Closed on
Aug 23, 2019
Sold by
Froslan Diane J and Froslan Lowell
Bought by
Nelson Erik
Purchase Details
Closed on
Aug 16, 2019
Sold by
Estate Of Norma G Reimers
Bought by
Nelson Erik
Create a Home Valuation Report for This Property
The Home Valuation Report is an in-depth analysis detailing your home's value as well as a comparison with similar homes in the area
Home Values in the Area
Average Home Value in this Area
Purchase History
| Date | Buyer | Sale Price | Title Company |
|---|---|---|---|
| Frederes Tyler | $175,000 | None Listed On Document | |
| Nelson Erik | -- | None Available | |
| Nelson Erik | $64,000 | None Available |
Source: Public Records
Mortgage History
| Date | Status | Borrower | Loan Amount |
|---|---|---|---|
| Open | Frederes Tyler | $140,000 |
Source: Public Records
Tax History Compared to Growth
Tax History
| Year | Tax Paid | Tax Assessment Tax Assessment Total Assessment is a certain percentage of the fair market value that is determined by local assessors to be the total taxable value of land and additions on the property. | Land | Improvement |
|---|---|---|---|---|
| 2025 | $1,470 | $173,150 | $14,720 | $158,430 |
| 2024 | $1,470 | $104,350 | $14,720 | $89,630 |
| 2023 | $1,294 | $104,350 | $14,720 | $89,630 |
| 2022 | $1,192 | $81,030 | $14,720 | $66,310 |
| 2021 | $1,192 | $81,030 | $14,720 | $66,310 |
| 2020 | $1,302 | $81,030 | $14,720 | $66,310 |
| 2019 | $1,192 | $81,030 | $0 | $0 |
| 2018 | $1,026 | $71,282 | $0 | $0 |
| 2017 | $1,026 | $71,282 | $0 | $0 |
| 2016 | $1,076 | $71,282 | $0 | $0 |
| 2015 | $956 | $60,925 | $0 | $0 |
| 2014 | $956 | $60,925 | $0 | $0 |
Source: Public Records
Map
Nearby Homes