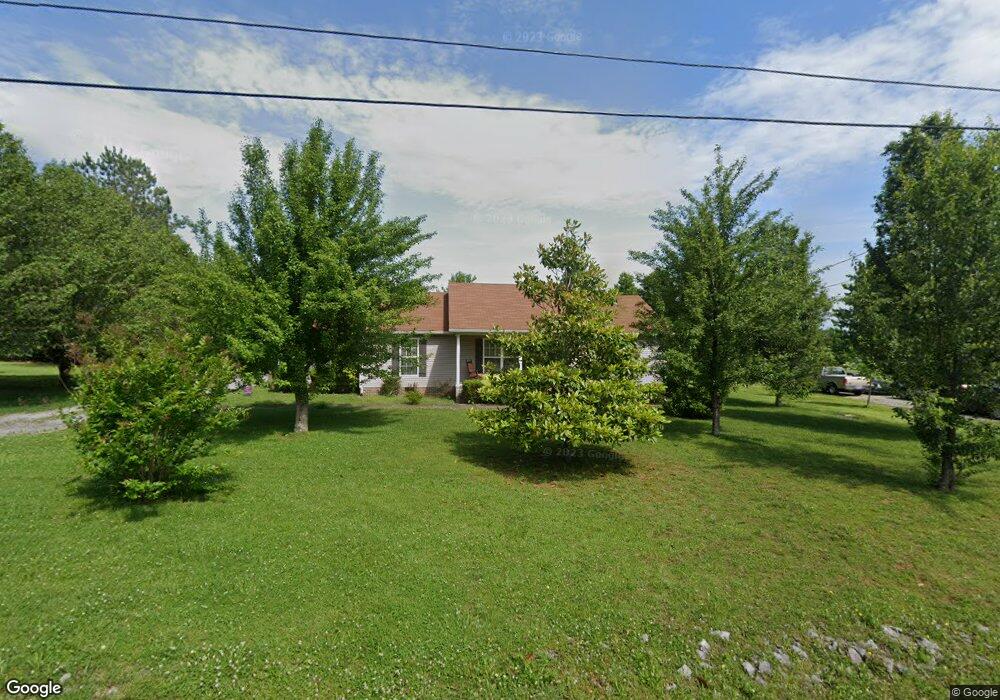
106 Sanders St Shelbyville, TN 37160
Estimated Value: $270,248 - $333,000
--
Bed
2
Baths
1,392
Sq Ft
$222/Sq Ft
Est. Value
About This Home
This home is located at 106 Sanders St, Shelbyville, TN 37160 and is currently estimated at $309,062, approximately $222 per square foot. 106 Sanders St is a home located in Bedford County with nearby schools including South Side Elementary School, Harris Middle School, and Christian Chapel Academy.
Ownership History
Date
Name
Owned For
Owner Type
Purchase Details
Closed on
Jul 31, 2003
Sold by
Moore Jeffrey
Bought by
Presley Ruby G
Current Estimated Value
Home Financials for this Owner
Home Financials are based on the most recent Mortgage that was taken out on this home.
Original Mortgage
$92,396
Outstanding Balance
$39,223
Interest Rate
5.24%
Estimated Equity
$269,839
Purchase Details
Closed on
Jun 21, 2001
Bought by
Moore Jeffrey Matt
Purchase Details
Closed on
Dec 8, 2000
Sold by
Sanders Bobby G
Bought by
Tennessee Homes Llc
Create a Home Valuation Report for This Property
The Home Valuation Report is an in-depth analysis detailing your home's value as well as a comparison with similar homes in the area
Home Values in the Area
Average Home Value in this Area
Purchase History
| Date | Buyer | Sale Price | Title Company |
|---|---|---|---|
| Presley Ruby G | $93,800 | -- | |
| Moore Jeffrey Matt | $88,000 | -- | |
| Tennessee Homes Llc | $15,000 | -- |
Source: Public Records
Mortgage History
| Date | Status | Borrower | Loan Amount |
|---|---|---|---|
| Open | Tennessee Homes Llc | $92,396 |
Source: Public Records
Tax History Compared to Growth
Tax History
| Year | Tax Paid | Tax Assessment Tax Assessment Total Assessment is a certain percentage of the fair market value that is determined by local assessors to be the total taxable value of land and additions on the property. | Land | Improvement |
|---|---|---|---|---|
| 2025 | -- | $42,725 | $0 | $0 |
| 2024 | -- | $42,725 | $9,500 | $33,225 |
| 2023 | $1,625 | $42,725 | $9,500 | $33,225 |
| 2022 | $1,672 | $42,725 | $9,500 | $33,225 |
| 2021 | $1,519 | $42,725 | $9,500 | $33,225 |
| 2020 | $1,219 | $42,725 | $9,500 | $33,225 |
| 2019 | $1,219 | $27,500 | $5,500 | $22,000 |
| 2018 | $1,191 | $27,500 | $5,500 | $22,000 |
| 2017 | $1,191 | $27,500 | $5,500 | $22,000 |
| 2016 | $1,180 | $27,500 | $5,500 | $22,000 |
| 2015 | $1,180 | $27,500 | $5,500 | $22,000 |
| 2014 | $1,021 | $26,050 | $0 | $0 |
Source: Public Records
Map
Nearby Homes
- 108 Sanders St
- 104 Sanders St
- 79 Providence Rd
- 81 Providence Rd
- 110 Sanders St
- 102 Sanders St
- 75 Providence Rd
- 107 Sanders St
- 105 Sanders St
- 83 Providence Rd
- 109 Sanders St
- 103 Sanders St
- 112 Sanders St
- 73 Providence Rd
- 80 Providence Rd
- 111 Sanders St
- 78 Providence Rd
- 100 Sanders St
- 114 Sanders St
- 203 Graydon St