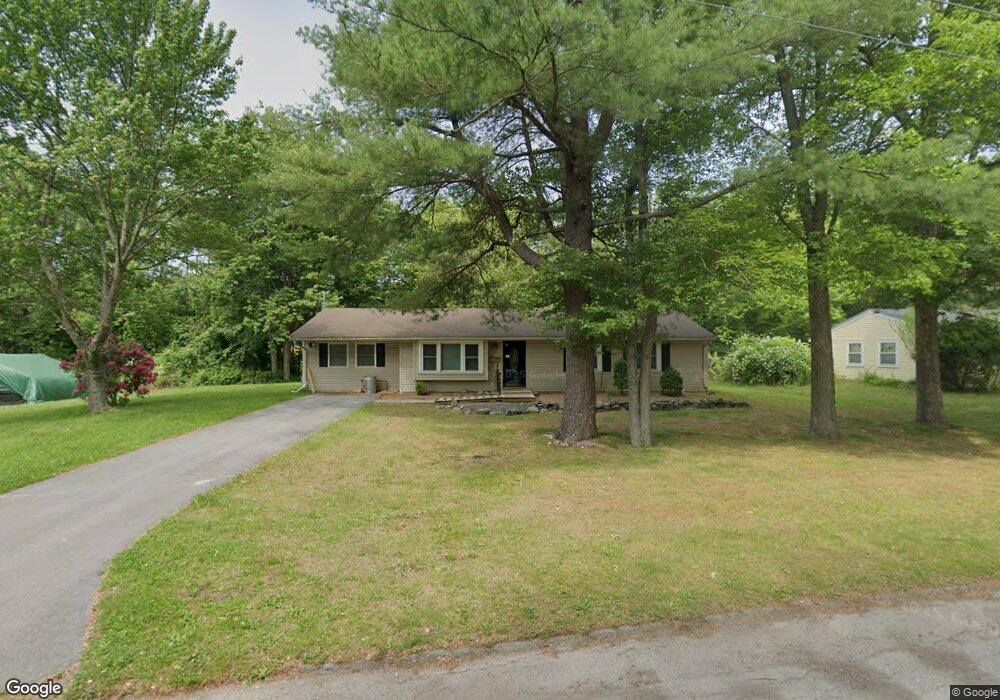
106 Sinclair Rd Brockton, MA 02302
Estimated Value: $455,132 - $486,000
3
Beds
1
Bath
1,316
Sq Ft
$358/Sq Ft
Est. Value
About This Home
This home is located at 106 Sinclair Rd, Brockton, MA 02302 and is currently estimated at $471,533, approximately $358 per square foot. 106 Sinclair Rd is a home located in Plymouth County with nearby schools including Gilmore Elementary School, Davis K-8 School, and John F. Kennedy Elementary School.
Ownership History
Date
Name
Owned For
Owner Type
Purchase Details
Closed on
Jun 17, 2011
Sold by
Kenney John P and Kenney Deborah L
Bought by
Kenney Deborah L
Current Estimated Value
Purchase Details
Closed on
Jun 19, 2008
Sold by
Hillegass Shawn M and Torres Stephanie
Bought by
Kenney John P and Kenney Deborah L
Home Financials for this Owner
Home Financials are based on the most recent Mortgage that was taken out on this home.
Original Mortgage
$125,000
Interest Rate
6.1%
Mortgage Type
Purchase Money Mortgage
Purchase Details
Closed on
Jun 23, 2005
Sold by
Bauer Kelly and Hillegass Kelly
Bought by
Hillegass Shawn M and Torres Stephanie
Purchase Details
Closed on
Jul 14, 1997
Sold by
Nash Charles E and Nash Barbara
Bought by
Hillegass Kelly
Create a Home Valuation Report for This Property
The Home Valuation Report is an in-depth analysis detailing your home's value as well as a comparison with similar homes in the area
Purchase History
| Date | Buyer | Sale Price | Title Company |
|---|---|---|---|
| Kenney Deborah L | -- | -- | |
| Kenney John P | $230,000 | -- | |
| Hillegass Shawn M | $180,000 | -- | |
| Hillegass Kelly | $76,000 | -- |
Source: Public Records
Mortgage History
| Date | Status | Borrower | Loan Amount |
|---|---|---|---|
| Previous Owner | Hillegass Kelly | $125,000 | |
| Previous Owner | Hillegass Kelly | $50,000 | |
| Previous Owner | Hillegass Kelly | $40,000 |
Source: Public Records
Tax History
| Year | Tax Paid | Tax Assessment Tax Assessment Total Assessment is a certain percentage of the fair market value that is determined by local assessors to be the total taxable value of land and additions on the property. | Land | Improvement |
|---|---|---|---|---|
| 2025 | $4,871 | $402,200 | $165,600 | $236,600 |
| 2024 | $4,778 | $397,500 | $165,600 | $231,900 |
| 2023 | $4,609 | $355,100 | $116,200 | $238,900 |
| 2022 | $4,269 | $305,600 | $105,600 | $200,000 |
| 2021 | $24,161 | $296,300 | $99,300 | $197,000 |
| 2020 | $4,360 | $287,800 | $86,500 | $201,300 |
| 2019 | $25,966 | $256,800 | $83,200 | $173,600 |
| 2018 | $3,744 | $233,100 | $83,200 | $149,900 |
| 2017 | $3,418 | $212,300 | $83,200 | $129,100 |
| 2016 | $3,592 | $206,900 | $79,300 | $127,600 |
| 2015 | $3,320 | $182,900 | $79,300 | $103,600 |
| 2014 | $3,543 | $195,400 | $79,300 | $116,100 |
Source: Public Records
Map
Nearby Homes
- 23 Dondi Rd
- 118 Deanna Rd
- 578 Plain St
- 15 Wachusetts Rd
- 12 Paulin Ave
- 1 Thomas Cir
- 549 Summer St
- 111 Riverview St
- 41 Riverview St
- 15 Longworth Ave Unit 226
- 9 Longworth Ave Unit 135
- 9 Longworth Ave Unit 113
- 25 Longworth Ave Unit 4
- 35 Longworth Ave Unit 25
- 100 Concord St
- 383 Summer St
- 31 Friendship Dr
- 463 Pleasant St
- 16 Liberty St
- 16 Jason Way
Your Personal Tour Guide
Ask me questions while you tour the home.