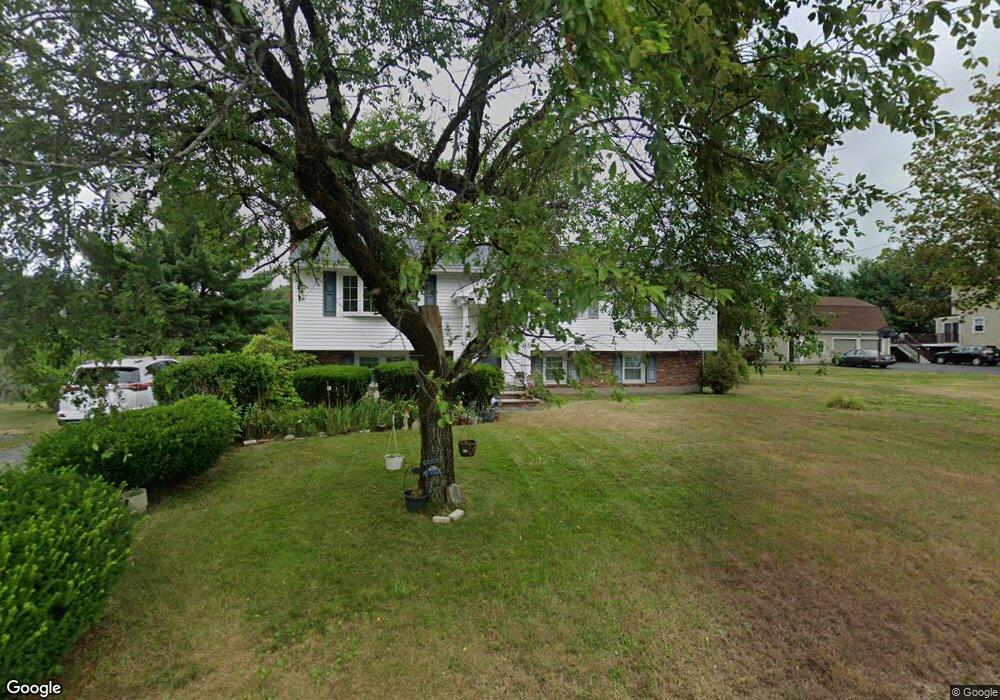
106 Smith Ave Stoughton, MA 02072
Estimated Value: $612,000 - $695,000
3
Beds
1
Bath
1,842
Sq Ft
$350/Sq Ft
Est. Value
About This Home
This home is located at 106 Smith Ave, Stoughton, MA 02072 and is currently estimated at $644,812, approximately $350 per square foot. 106 Smith Ave is a home located in Norfolk County with nearby schools including Helen Hansen Elementary School, Dr. Robert G. O'Donnell Middle School, and Stoughton High School.
Ownership History
Date
Name
Owned For
Owner Type
Purchase Details
Closed on
Mar 1, 2022
Sold by
Ranero Concepcion I
Bought by
Idalia Ranero T C and Idalia Ranero
Current Estimated Value
Purchase Details
Closed on
Sep 27, 1994
Sold by
Lindenbaum Marc
Bought by
Ranero Concepcion I
Home Financials for this Owner
Home Financials are based on the most recent Mortgage that was taken out on this home.
Original Mortgage
$70,000
Interest Rate
8.56%
Mortgage Type
Purchase Money Mortgage
Purchase Details
Closed on
Jul 5, 1994
Sold by
Salzberg Ronald M
Bought by
Lindenbaum Marc
Create a Home Valuation Report for This Property
The Home Valuation Report is an in-depth analysis detailing your home's value as well as a comparison with similar homes in the area
Home Values in the Area
Average Home Value in this Area
Purchase History
| Date | Buyer | Sale Price | Title Company |
|---|---|---|---|
| Idalia Ranero T C | -- | None Available | |
| Idalia Ranero T C | -- | None Available | |
| Idalia Ranero T C | -- | None Available | |
| Ranero Concepcion I | $139,500 | -- | |
| Ranero Concepcion I | $139,500 | -- | |
| Lindenbaum Marc | $74,450 | -- | |
| Lindenbaum Marc | $74,450 | -- |
Source: Public Records
Mortgage History
| Date | Status | Borrower | Loan Amount |
|---|---|---|---|
| Previous Owner | Lindenbaum Marc | $162,000 | |
| Previous Owner | Lindenbaum Marc | $70,000 |
Source: Public Records
Tax History Compared to Growth
Tax History
| Year | Tax Paid | Tax Assessment Tax Assessment Total Assessment is a certain percentage of the fair market value that is determined by local assessors to be the total taxable value of land and additions on the property. | Land | Improvement |
|---|---|---|---|---|
| 2025 | $6,186 | $499,700 | $222,800 | $276,900 |
| 2024 | $5,993 | $470,800 | $203,500 | $267,300 |
| 2023 | $5,738 | $423,500 | $186,000 | $237,500 |
| 2022 | $5,650 | $392,100 | $179,000 | $213,100 |
| 2021 | $5,397 | $357,400 | $157,900 | $199,500 |
| 2020 | $5,200 | $349,200 | $157,900 | $191,300 |
| 2019 | $5,259 | $342,800 | $157,900 | $184,900 |
| 2018 | $4,637 | $313,100 | $154,400 | $158,700 |
| 2017 | $4,443 | $306,600 | $152,700 | $153,900 |
| 2016 | $4,326 | $289,000 | $143,900 | $145,100 |
| 2015 | $4,239 | $280,200 | $135,100 | $145,100 |
| 2014 | $4,107 | $260,900 | $122,800 | $138,100 |
Source: Public Records
Map
Nearby Homes