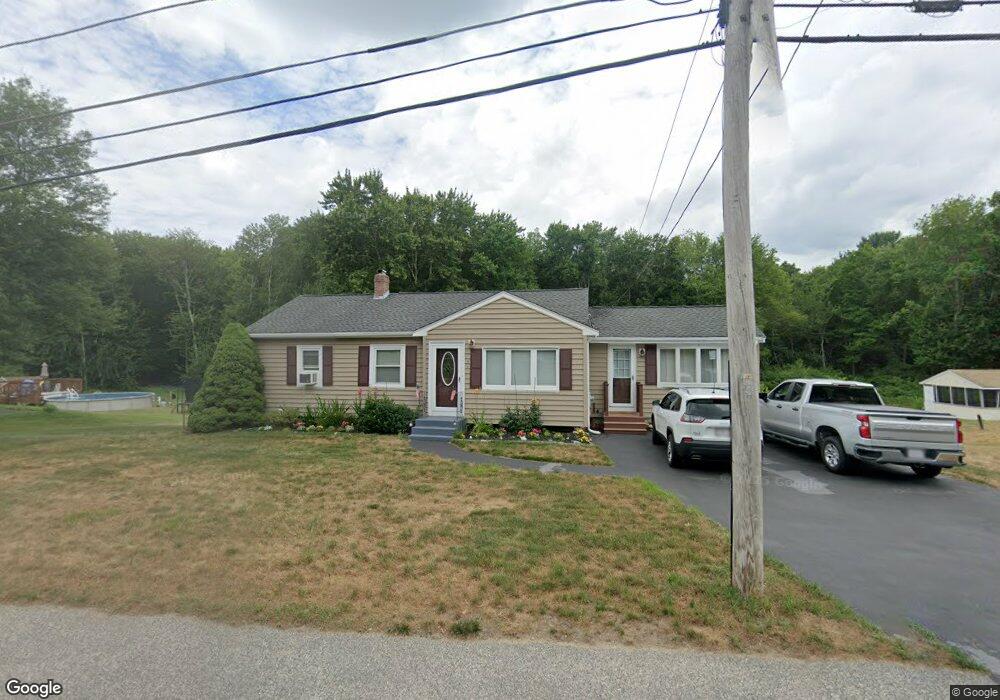
106 Summer St Foxboro, MA 02035
Estimated Value: $564,000 - $606,000
3
Beds
3
Baths
1,232
Sq Ft
$474/Sq Ft
Est. Value
About This Home
This home is located at 106 Summer St, Foxboro, MA 02035 and is currently estimated at $584,199, approximately $474 per square foot. 106 Summer St is a home located in Norfolk County with nearby schools including Foxborough High School, St Mary's Catholic School, and Hands-On-Montessori School.
Ownership History
Date
Name
Owned For
Owner Type
Purchase Details
Closed on
Jul 6, 2022
Sold by
Rosado Kerry A and Rosado Janice E
Bought by
Rosado Kerry A and Rosado Janice E
Current Estimated Value
Purchase Details
Closed on
Oct 28, 1980
Bought by
Rosado Kerry A and Rosado Janice E
Create a Home Valuation Report for This Property
The Home Valuation Report is an in-depth analysis detailing your home's value as well as a comparison with similar homes in the area
Home Values in the Area
Average Home Value in this Area
Purchase History
| Date | Buyer | Sale Price | Title Company |
|---|---|---|---|
| Rosado Kerry A | -- | None Available | |
| Rosado Kerry A | $48,200 | -- |
Source: Public Records
Mortgage History
| Date | Status | Borrower | Loan Amount |
|---|---|---|---|
| Previous Owner | Rosado Kerry A | $100,000 | |
| Previous Owner | Rosado Kerry A | $85,000 |
Source: Public Records
Tax History
| Year | Tax Paid | Tax Assessment Tax Assessment Total Assessment is a certain percentage of the fair market value that is determined by local assessors to be the total taxable value of land and additions on the property. | Land | Improvement |
|---|---|---|---|---|
| 2025 | $6,101 | $461,500 | $217,800 | $243,700 |
| 2024 | $5,830 | $431,500 | $217,800 | $213,700 |
| 2023 | $5,280 | $371,600 | $207,400 | $164,200 |
| 2022 | $5,381 | $370,600 | $198,400 | $172,200 |
| 2021 | $5,116 | $347,100 | $180,300 | $166,800 |
| 2020 | $4,872 | $334,400 | $180,300 | $154,100 |
| 2019 | $4,705 | $320,100 | $171,700 | $148,400 |
| 2018 | $4,582 | $314,500 | $171,700 | $142,800 |
| 2017 | $4,392 | $292,000 | $160,500 | $131,500 |
| 2016 | $4,212 | $284,200 | $154,400 | $129,800 |
| 2015 | $3,993 | $262,900 | $130,400 | $132,500 |
| 2014 | $3,942 | $263,000 | $127,800 | $135,200 |
Source: Public Records
Map
Nearby Homes
- 261 East St
- 9 Independence Dr Unit 9
- 3 Willow St
- 26 Fredric Ln
- 619 N Main St
- 3 Wampanoag Rd
- 25 Kingman Ave
- 165 Chestnut St Unit 2
- 81 Chilson Ave
- 13 Summerville Rd Unit 13
- 147 Chestnut St Unit A
- 147 Chestnut St Unit B
- 631 East St Unit L101
- 233 Central St
- 122 Samoset Ave
- 22 Pleasant St Unit B
- 4 Erick Rd Unit 90
- 46 Hope St
- 356 Central St
- 26 Fuller Rd Unit 6
Your Personal Tour Guide
Ask me questions while you tour the home.