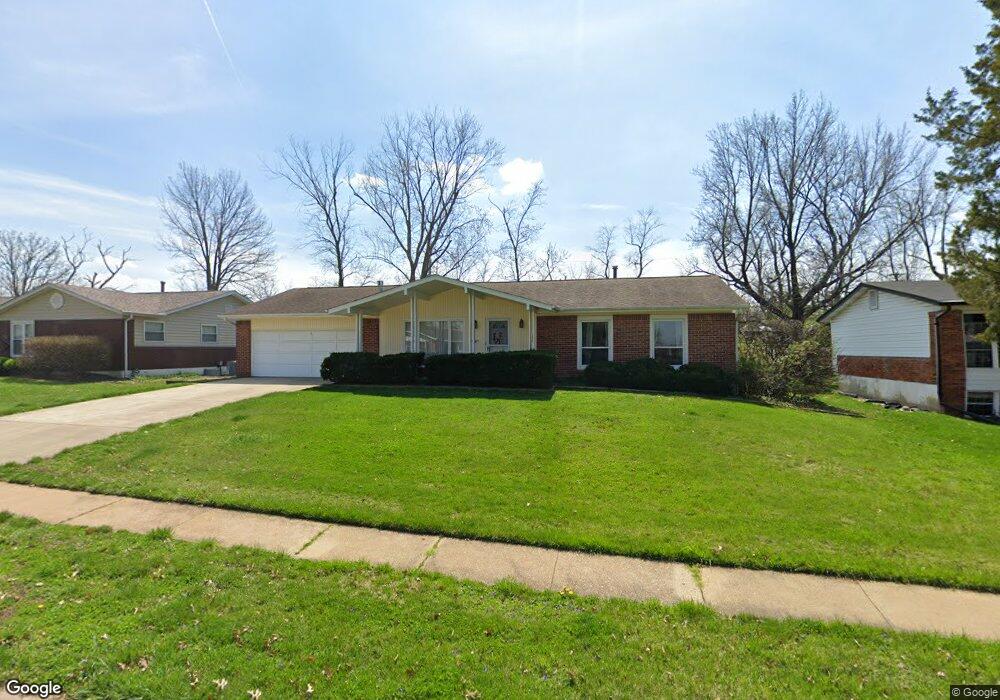
106 Timka Dr Ballwin, MO 63011
Estimated Value: $334,915 - $390,000
3
Beds
2
Baths
1,378
Sq Ft
$261/Sq Ft
Est. Value
About This Home
This home is located at 106 Timka Dr, Ballwin, MO 63011 and is currently estimated at $360,229, approximately $261 per square foot. 106 Timka Dr is a home located in St. Louis County with nearby schools including Westridge Elementary School, Crestview Middle School, and Marquette Sr. High School.
Ownership History
Date
Name
Owned For
Owner Type
Purchase Details
Closed on
Oct 2, 2023
Sold by
Youngren Julie Ann
Bought by
Julie Youngren Revocable Living Trust and Youngren
Current Estimated Value
Purchase Details
Closed on
Jul 28, 2017
Sold by
Youngren Fern Elizabeth
Bought by
Youngren Julie Ann
Home Financials for this Owner
Home Financials are based on the most recent Mortgage that was taken out on this home.
Original Mortgage
$100,000
Interest Rate
3.9%
Mortgage Type
New Conventional
Purchase Details
Closed on
Jun 23, 1999
Sold by
Grasso Bros Inc
Bought by
First National Bank Of The Mid South and Montgomery First National Bank
Purchase Details
Closed on
May 26, 1999
Sold by
Youngren Fern Elizabeth
Bought by
Youngren Fern Elizabeth and The Fern Elizabeth Revocable Trust
Create a Home Valuation Report for This Property
The Home Valuation Report is an in-depth analysis detailing your home's value as well as a comparison with similar homes in the area
Home Values in the Area
Average Home Value in this Area
Purchase History
| Date | Buyer | Sale Price | Title Company |
|---|---|---|---|
| Julie Youngren Revocable Living Trust | -- | None Listed On Document | |
| Youngren Julie Ann | -- | Investors Title Co Clayton | |
| First National Bank Of The Mid South | $217,765 | -- | |
| Youngren Fern Elizabeth | -- | -- |
Source: Public Records
Mortgage History
| Date | Status | Borrower | Loan Amount |
|---|---|---|---|
| Previous Owner | Youngren Julie Ann | $100,000 |
Source: Public Records
Tax History
| Year | Tax Paid | Tax Assessment Tax Assessment Total Assessment is a certain percentage of the fair market value that is determined by local assessors to be the total taxable value of land and additions on the property. | Land | Improvement |
|---|---|---|---|---|
| 2025 | $3,932 | $59,820 | $24,990 | $34,830 |
| 2024 | $3,932 | $56,150 | $17,860 | $38,290 |
| 2023 | $3,929 | $56,150 | $17,860 | $38,290 |
| 2022 | $3,248 | $43,040 | $19,630 | $23,410 |
| 2021 | $3,224 | $43,040 | $19,630 | $23,410 |
| 2020 | $3,121 | $39,710 | $17,160 | $22,550 |
| 2019 | $3,133 | $39,710 | $17,160 | $22,550 |
| 2018 | $2,925 | $34,940 | $13,360 | $21,580 |
| 2017 | $2,856 | $34,940 | $13,360 | $21,580 |
| 2016 | $2,742 | $32,250 | $9,540 | $22,710 |
Source: Public Records
Map
Nearby Homes
- 275 Essen Ct Unit TBB
- 429 Fairview Ct
- 212 Lakeside Dr
- 548 Windsor Mill Dr
- 114 Lea Meadows Dr
- 521 Kehrs Mill Rd
- 312 Ballwin Ave
- 313 Saint Lawrence Dr
- 112 Shirley Ln
- 401 Hillcrest Blvd
- 408 Saint Lawrence Dr
- 203 Morewood Dr
- 107 Falmouth Dr
- 277 Oak Path Dr
- 202 Wildbrier Dr
- 3 Chappel Ct
- 247 Ramsey Ln
- 103 Denbigh Terrace
- 332 Remington Way Dr
- 323 Chipley Cir
Your Personal Tour Guide
Ask me questions while you tour the home.