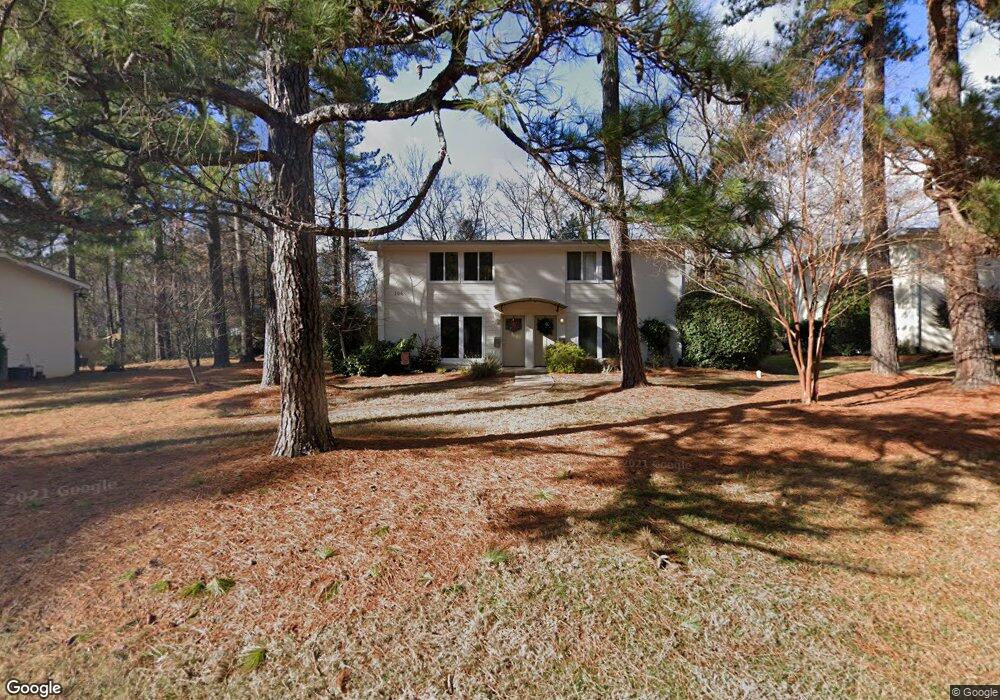
106 Todd St Unit A Carrboro, NC 27510
Estimated Value: $346,000 - $401,000
2
Beds
1
Bath
1,021
Sq Ft
$366/Sq Ft
Est. Value
About This Home
This home is located at 106 Todd St Unit A, Carrboro, NC 27510 and is currently estimated at $373,566, approximately $365 per square foot. 106 Todd St Unit A is a home located in Orange County with nearby schools including Smith Middle School and Chapel Hill High School.
Ownership History
Date
Name
Owned For
Owner Type
Purchase Details
Closed on
Apr 30, 2020
Sold by
Binkley Allison Jones and Binkley Derek Russell
Bought by
Deckner Renate Maria Elisabeth and Stuermer Til Hans
Current Estimated Value
Purchase Details
Closed on
Apr 27, 2017
Sold by
Richardson Elisabeth Sinclair and Kent Steven P
Bought by
Binkley Allison Jones and Binkley Derek Russell
Home Financials for this Owner
Home Financials are based on the most recent Mortgage that was taken out on this home.
Original Mortgage
$197,000
Interest Rate
4.5%
Mortgage Type
Adjustable Rate Mortgage/ARM
Purchase Details
Closed on
Feb 2, 2007
Sold by
Todd Street Llc
Bought by
Richardson Elisabeth Sinclair
Home Financials for this Owner
Home Financials are based on the most recent Mortgage that was taken out on this home.
Original Mortgage
$146,768
Interest Rate
6.27%
Mortgage Type
Purchase Money Mortgage
Create a Home Valuation Report for This Property
The Home Valuation Report is an in-depth analysis detailing your home's value as well as a comparison with similar homes in the area
Home Values in the Area
Average Home Value in this Area
Purchase History
| Date | Buyer | Sale Price | Title Company |
|---|---|---|---|
| Deckner Renate Maria Elisabeth | $220,000 | None Available | |
| Binkley Allison Jones | $196,000 | None Available | |
| Richardson Elisabeth Sinclair | $184,000 | None Available |
Source: Public Records
Mortgage History
| Date | Status | Borrower | Loan Amount |
|---|---|---|---|
| Previous Owner | Binkley Allison Jones | $197,000 | |
| Previous Owner | Richardson Elisabeth Sinclair | $146,768 |
Source: Public Records
Tax History Compared to Growth
Tax History
| Year | Tax Paid | Tax Assessment Tax Assessment Total Assessment is a certain percentage of the fair market value that is determined by local assessors to be the total taxable value of land and additions on the property. | Land | Improvement |
|---|---|---|---|---|
| 2025 | $4,763 | $334,800 | $0 | $334,800 |
| 2024 | $3,900 | $219,900 | $0 | $219,900 |
| 2023 | $3,833 | $219,900 | $0 | $219,900 |
| 2022 | $3,791 | $219,900 | $0 | $219,900 |
| 2021 | $3,764 | $219,900 | $0 | $219,900 |
| 2020 | $3,497 | $195,600 | $0 | $195,600 |
| 2018 | $3,428 | $195,600 | $0 | $195,600 |
| 2017 | $3,448 | $195,600 | $0 | $195,600 |
| 2016 | $3,448 | $199,347 | $26,400 | $172,947 |
| 2015 | $3,448 | $199,347 | $26,400 | $172,947 |
| 2014 | $3,392 | $199,347 | $26,400 | $172,947 |
Source: Public Records
Map
Nearby Homes
- 409 Lindsay St
- 104 Sparkleberry Ln
- 102 Sue Ann Ct Unit A And B
- 702 N Greensboro St
- 506 N Greensboro St Unit 35
- 101 Thomas Ln Unit D-3
- 103 W Poplar Ave
- 201 Weathervane Dr
- 107 Hillcrest Ave Unit C & D
- 105 Fidelity St Unit B9
- 105 Fidelity St Unit A52
- 105 Fidelity St Unit A40
- 108 High St
- 124 Fidelity St Unit 27
- 200 Davie Rd Unit A&B
- 240 Jay St
- 100 Raven Ln
- 121 W Braxton Foushee St
- 110 Ruth St
- 307 Sunset Dr
- 106 Todd St
- 104 Todd St Unit A
- 104 Todd St Unit B
- 108 Todd St Unit A
- 108 Todd St
- 108 Todd St Unit B
- 102 Todd St
- 102 Todd St Unit C
- 102 Todd St Unit D
- 105 Todd St Unit B
- 105 Todd St Unit B
- 105 Todd St
- 103 Todd St Unit C
- 103 Todd St Unit A
- 103 Todd St Unit D
- 103 Todd St Unit B
- 103 Todd St
- 901 N Greensboro St Unit B
- 905 N Greensboro St
- 905 N Greensboro St