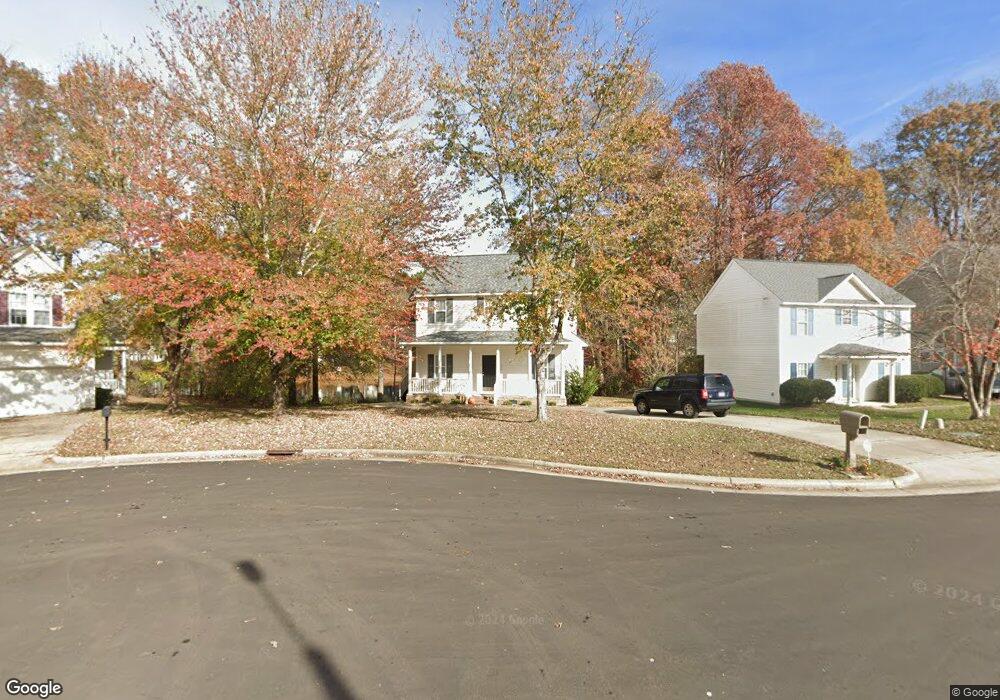
106 Tortola Place Knightdale, NC 27545
Estimated Value: $296,000 - $326,588
3
Beds
3
Baths
1,338
Sq Ft
$237/Sq Ft
Est. Value
About This Home
This home is located at 106 Tortola Place, Knightdale, NC 27545 and is currently estimated at $317,147, approximately $237 per square foot. 106 Tortola Place is a home located in Wake County with nearby schools including Knightdale Elementary School, Neuse River Middle School, and Knightdale High.
Ownership History
Date
Name
Owned For
Owner Type
Purchase Details
Closed on
Sep 28, 2020
Sold by
Siu Dreng and Siu Rmah H
Bought by
Perry Noel
Current Estimated Value
Home Financials for this Owner
Home Financials are based on the most recent Mortgage that was taken out on this home.
Original Mortgage
$222,740
Outstanding Balance
$198,115
Interest Rate
2.9%
Mortgage Type
VA
Estimated Equity
$119,032
Purchase Details
Closed on
May 16, 2006
Sold by
Phoenix Builders Inc
Bought by
Siu Dreng and Siu Rmah H
Home Financials for this Owner
Home Financials are based on the most recent Mortgage that was taken out on this home.
Original Mortgage
$50,000
Interest Rate
6.39%
Mortgage Type
Unknown
Purchase Details
Closed on
Sep 12, 2005
Sold by
Spectrum Homes Inc
Bought by
Phoenix Builders Inc
Create a Home Valuation Report for This Property
The Home Valuation Report is an in-depth analysis detailing your home's value as well as a comparison with similar homes in the area
Home Values in the Area
Average Home Value in this Area
Purchase History
| Date | Buyer | Sale Price | Title Company |
|---|---|---|---|
| Perry Noel | $215,000 | None Available | |
| Siu Dreng | $130,000 | None Available | |
| Phoenix Builders Inc | $66,000 | None Available |
Source: Public Records
Mortgage History
| Date | Status | Borrower | Loan Amount |
|---|---|---|---|
| Open | Perry Noel | $222,740 | |
| Previous Owner | Siu Dreng | $50,000 | |
| Previous Owner | Siu Dreng | $79,900 |
Source: Public Records
Tax History Compared to Growth
Tax History
| Year | Tax Paid | Tax Assessment Tax Assessment Total Assessment is a certain percentage of the fair market value that is determined by local assessors to be the total taxable value of land and additions on the property. | Land | Improvement |
|---|---|---|---|---|
| 2025 | $3,057 | $317,342 | $93,500 | $223,842 |
| 2024 | $3,046 | $317,342 | $93,500 | $223,842 |
| 2023 | $2,096 | $187,560 | $41,800 | $145,760 |
| 2022 | $2,026 | $187,560 | $41,800 | $145,760 |
| 2021 | $1,933 | $187,560 | $41,800 | $145,760 |
| 2020 | $1,933 | $187,560 | $41,800 | $145,760 |
| 2019 | $1,729 | $148,558 | $41,800 | $106,758 |
| 2018 | $1,631 | $148,558 | $41,800 | $106,758 |
| 2017 | $1,572 | $148,558 | $41,800 | $106,758 |
| 2016 | $1,551 | $148,558 | $41,800 | $106,758 |
| 2015 | $1,516 | $143,273 | $37,000 | $106,273 |
| 2014 | $1,464 | $143,273 | $37,000 | $106,273 |
Source: Public Records
Map
Nearby Homes
- 104 Saint Johns St
- 302 Brakeman St
- 102 Switchback St
- 612 Crosstie St
- 216 Walbury Dr
- 619 Laurens Way
- 413 Laurens Way
- 1442 Jay Rd
- 1452 Jay Rd
- 1500 Wader Cir
- 1456 Jay Rd
- 1516 Wader Cir
- 1463 Jay Rd
- 1448 Jay Rd
- 1700 Goldfinch Perch Ln
- 1580 Goldfinch Perch Ln
- 444 Haywood Glen Dr
- 1512 Wader Cir
- 1466 Jay Rd
- 1504 Wader Cir
- 108 Tortola Place
- 104 Tortola Place
- 102 Tortola Place
- 110 Tortola Place
- 107 Tortola Place
- 101 Tortola Place
- 109 Tortola Place
- 112 Tortola Place
- 103 Tortola Place
- 105 Tortola Place
- 111 Tortola Place
- 114 Tortola Place
- 205 Caribbean Ct
- 116 Tortola Place
- 119 Saint Johns St
- 121 Saint Johns St
- 3005 Gallows Way
- 117 St Johns St
- 117 Saint Johns St
- 119 St Johns St