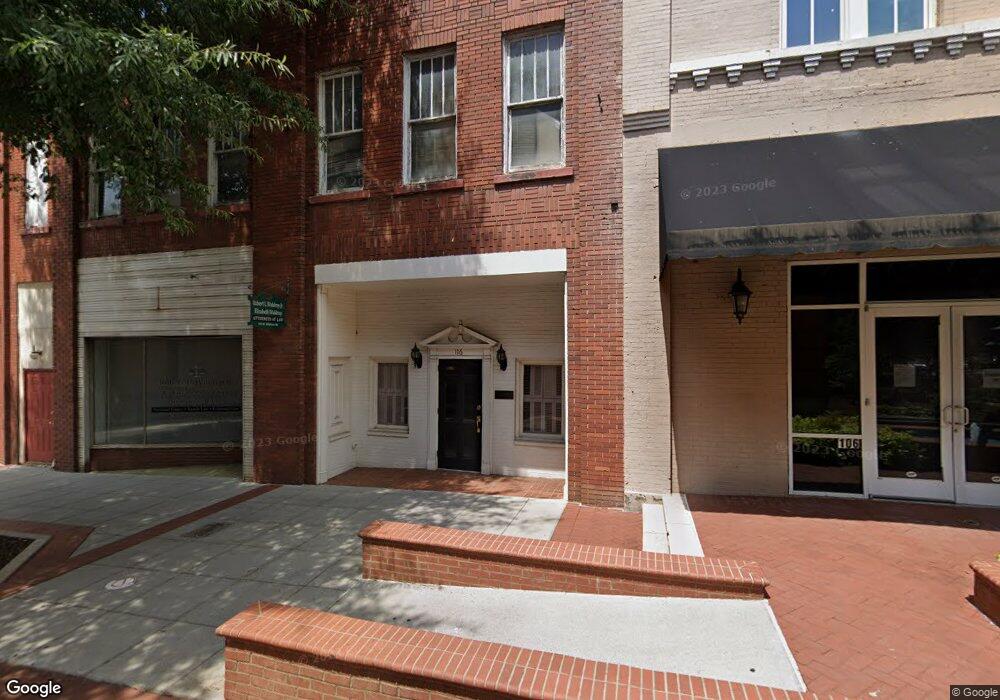
106 W Whitner St Anderson, SC 29624
Estimated Value: $263,000 - $385,000
--
Bed
--
Bath
--
Sq Ft
--
Built
About This Home
This home is located at 106 W Whitner St, Anderson, SC 29624 and is currently estimated at $309,673. 106 W Whitner St is a home located in Anderson County with nearby schools including Calhoun Academy of the Arts, McCants Middle School, and T.L. Hanna High School.
Ownership History
Date
Name
Owned For
Owner Type
Purchase Details
Closed on
Nov 18, 2021
Sold by
Chiquola Condominium Owner Association I
Bought by
Chiquola Horizontal Property Regime
Current Estimated Value
Purchase Details
Closed on
Sep 21, 2020
Sold by
Stegall Joanna B
Bought by
Granillo Fredy E
Purchase Details
Closed on
Mar 28, 2019
Sold by
Henderson Lisa
Bought by
Stegall Joanna B
Home Financials for this Owner
Home Financials are based on the most recent Mortgage that was taken out on this home.
Original Mortgage
$155,250
Interest Rate
4.62%
Mortgage Type
Adjustable Rate Mortgage/ARM
Purchase Details
Closed on
Aug 24, 2016
Sold by
Melton Scott and Melton Ann
Bought by
Henderson Lisa
Purchase Details
Closed on
Jul 26, 2011
Sold by
Capitalbank
Bought by
Verdant Enterprises Llc
Purchase Details
Closed on
Mar 20, 2011
Sold by
Verdant Enterprises Llc
Bought by
Melton Scott and Melton Ann
Create a Home Valuation Report for This Property
The Home Valuation Report is an in-depth analysis detailing your home's value as well as a comparison with similar homes in the area
Home Values in the Area
Average Home Value in this Area
Purchase History
| Date | Buyer | Sale Price | Title Company |
|---|---|---|---|
| Chiquola Horizontal Property Regime | -- | None Listed On Document | |
| Granillo Fredy E | $184,000 | None Available | |
| Stegall Joanna B | $178,000 | None Available | |
| Henderson Lisa | $120,000 | None Available | |
| Verdant Enterprises Llc | $68,000 | -- | |
| Melton Scott | -- | -- |
Source: Public Records
Mortgage History
| Date | Status | Borrower | Loan Amount |
|---|---|---|---|
| Previous Owner | Stegall Joanna B | $155,250 |
Source: Public Records
Tax History Compared to Growth
Tax History
| Year | Tax Paid | Tax Assessment Tax Assessment Total Assessment is a certain percentage of the fair market value that is determined by local assessors to be the total taxable value of land and additions on the property. | Land | Improvement |
|---|---|---|---|---|
| 2024 | $5,415 | $15,460 | $0 | $15,460 |
| 2023 | $5,415 | $15,460 | $0 | $15,460 |
| 2022 | $5,296 | $15,460 | $0 | $15,460 |
| 2021 | $4,839 | $11,040 | $0 | $11,040 |
| 2020 | $1,637 | $7,120 | $0 | $7,120 |
| 2019 | $1,127 | $4,800 | $0 | $4,800 |
| 2018 | $1,137 | $4,800 | $0 | $4,800 |
| 2017 | -- | $4,800 | $0 | $4,800 |
| 2016 | $2,199 | $5,080 | $0 | $5,080 |
| 2015 | $2,213 | $5,080 | $0 | $5,080 |
| 2014 | $2,185 | $5,080 | $0 | $5,080 |
Source: Public Records
Map
Nearby Homes
- 100 W Whitner St Unit 206
- 100 W Whitner St Unit 102
- 100 W Whitner St Unit 105 The Chiquola
- 100 W Whitner St Unit 107 The Chiquola
- 100 W Whitner St Unit 205 The Chiquola
- 103 N Main St Unit 305
- 100 W Whitner St Unit s Retail & Restu
- 100 W Whitner St Unit 202
- 103 N Main St
- 103 N Main St Unit 103
- 103 N Main St Unit The Chiquola Unit 2
- 103 N Main St Unit The Chiquola Unit 1
- 103 N Main St Unit The Chiquola Unit 3
- 100 W Whitner St Unit The Chiquola Unit 1
- 100 W Whitner St Unit The Chiquola Unit 2
- 100 W Whitner St Unit Chiquola Condo 101
- 100 W Whitner St Unit Chiquola Retail & Re
- 100 W Whitner St Unit The Chiquola Unit 3
- 103 N Main St Unit The Chiquola Unit
- 103 N Main St Unit 204