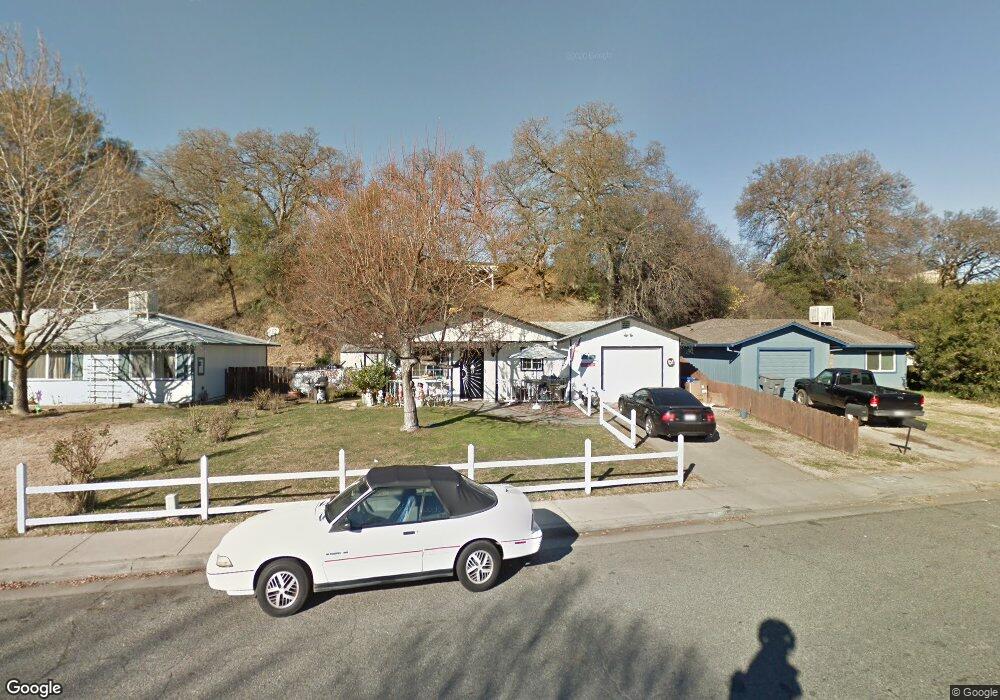
1060 Aloha St Red Bluff, CA 96080
Estimated Value: $239,000 - $266,000
3
Beds
2
Baths
1,125
Sq Ft
$226/Sq Ft
Est. Value
About This Home
This home is located at 1060 Aloha St, Red Bluff, CA 96080 and is currently estimated at $254,066, approximately $225 per square foot. 1060 Aloha St is a home located in Tehama County with nearby schools including Jackson Heights Elementary School, Vista Preparatory Academy, and Red Bluff High School.
Ownership History
Date
Name
Owned For
Owner Type
Purchase Details
Closed on
Apr 19, 2018
Sold by
Bowen Wayne M
Bought by
Moulton Rhonda M
Current Estimated Value
Purchase Details
Closed on
Jun 25, 2003
Sold by
Coeee Homes & Investments Inc
Bought by
Bowen Wayne M
Purchase Details
Closed on
Jun 19, 2003
Sold by
Dahl Anthony J and Dahl Adrianne M
Bought by
Coeee Homes & Investments Inc
Create a Home Valuation Report for This Property
The Home Valuation Report is an in-depth analysis detailing your home's value as well as a comparison with similar homes in the area
Purchase History
| Date | Buyer | Sale Price | Title Company |
|---|---|---|---|
| Moulton Rhonda M | -- | None Available | |
| Bowen Wayne M | $125,000 | Fidelity National Title | |
| Coeee Homes & Investments Inc | $84,000 | Fidelity National Title |
Source: Public Records
Tax History
| Year | Tax Paid | Tax Assessment Tax Assessment Total Assessment is a certain percentage of the fair market value that is determined by local assessors to be the total taxable value of land and additions on the property. | Land | Improvement |
|---|---|---|---|---|
| 2025 | $1,736 | $177,714 | $49,757 | $127,957 |
| 2024 | $1,736 | $174,231 | $48,782 | $125,449 |
| 2023 | $1,705 | $170,816 | $47,826 | $122,990 |
| 2022 | $1,692 | $167,468 | $46,889 | $120,579 |
| 2021 | $1,587 | $160,672 | $44,988 | $115,684 |
| 2020 | $1,414 | $139,715 | $39,120 | $100,595 |
| 2019 | $1,452 | $139,715 | $39,120 | $100,595 |
| 2018 | $1,311 | $127,014 | $35,564 | $91,450 |
| 2017 | $1,227 | $115,467 | $32,331 | $83,136 |
| 2016 | $1,043 | $109,968 | $30,791 | $79,177 |
| 2015 | $1,042 | $109,968 | $30,791 | $79,177 |
| 2014 | $903 | $95,625 | $26,775 | $68,850 |
Source: Public Records
Map
Nearby Homes
- 224 S Jackson St
- 845 Olive St
- 406 S Jackson St
- 425 S Jackson St
- 1160 Orange St
- 660 Villa Dr
- 629 Johnson St
- 728 Lincoln St
- 524 Madison St
- 532 Madison St
- 855 Johnson St
- 1435 Garryana Dr
- 541 Jefferson St
- 1455 Acacia St
- 1212 S Jackson St
- 1660 El Cerrito Ct
- 927 Cedar St
- 1235 Britt Ln
- 1280 Southpointe Dr
- 180 S Main St